I noticed
over time several reports in technical forums of slow IKEv2 performance, with
the observed performance often being quoted as just 10% to 20% of the expected
performance; troubleshooting network performance problems almost always
requires making network traces and, on the few occasions that I offered to help
with the analysis, there was an (understandable) unwillingness to share trace
data. When someone agreed to share the data, the analysis proved to be trickier
than expected.
The
first network trace
The first
trace used a combination of two ETW providers: Microsoft-Windows-PktMon (with
keywords 0x10) and Microsoft-Windows-TCPIP (with keywords 0x200500000020 and
level 16). I had used this combination before when troubleshooting problems
with the TCP CUBIC congestion algorithm and out-of-sequence delivery of TCP
packets (see here)
and developed a simple tool to visualize interesting aspects of the captured
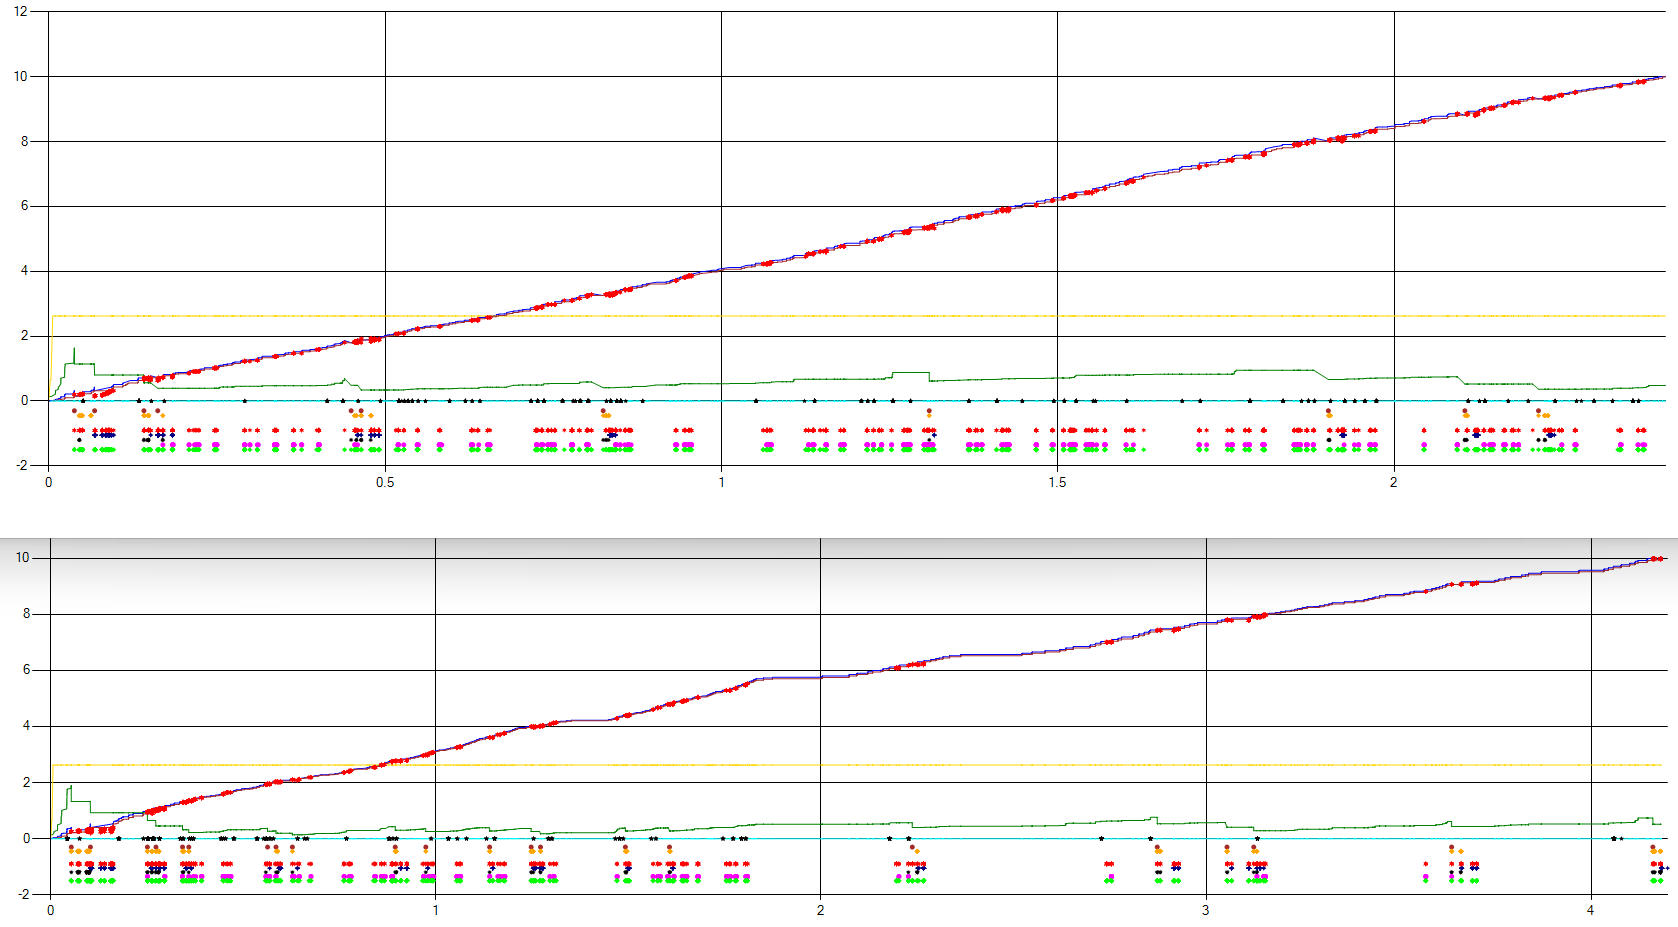
data. This is what the tool showed:
The blue line is the TCP send sequence number; the green
line is the size of the congestion window (not to scale on the Y-axis – it is
its shape that is most interesting); the yellow line is the send window (to
same scale as congestion window).
At 6 arbitrary Y-values, points are shown when “interesting”
events occur; the events are:
·
TcpEarlyRetransmit
·
TcpLossRecoverySend Fast Retransmit
·
TcpLossRecoverySend SACK Retransmit
·
TcpDataTransferRetransmit
·
TcpTcbExpireTimer RetransmitTimer
·
D-SACK [RFC3708] arrival
The black points on the horizontal access indicate when
IPsec ESP sequence numbers are detected “out-of-sequence”. In contrast to the
other data and events, which all refer to the same TCP connection, this
information is not necessarily related to the same TCP connection but is
“circumstantially” related. The reason for this is that it is difficult to know
what is “inside” a particular ESP packet; by combining information from several
ETW providers, it is often possible to infer what is inside, but that is not
essential for this visualization tool – the temporal relationship between
events often “suggests” whether a (causal) link possibly exists.
The traffic being measured in the trace/graph is 10 back-to-back
sends of a one megabyte block to the “discard” port on the “server”, so there
is no application protocol hand-shaking or other overheads.
I had initially expected to see something like a
fragmentation problem, but the graph looked exactly like the TCP CUBIC
out-of-sequence behaviour. This was surprising because the client and server
were on the same network, which made it unlikely that network equipment was
causing the disorder in the packet sequencing.
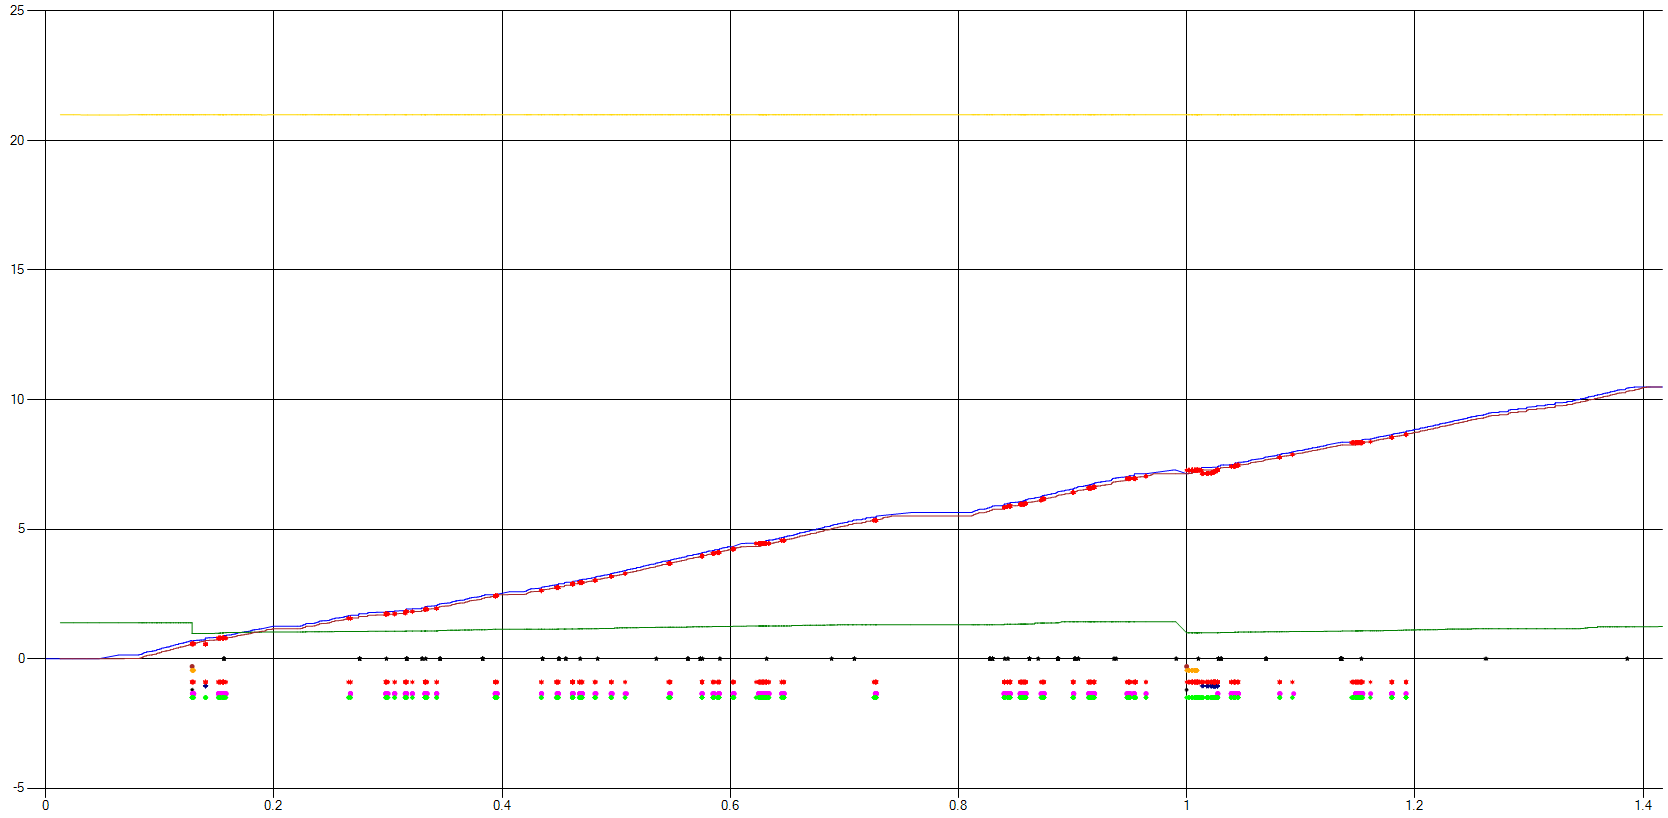
For comparison purposes, this is what the visualization of a
“good” transfer looks like:
The first surprise
A more detailed look at the trace data revealed that data
carrying (large) ESP packets were leaving the sender with the ESP sequence
numbers sometimes “disordered”. The ESP RFC 2406 describes
the generation and verification of sequence numbers and one would certainly
expect the transmitted sequence numbers to just monotonically count upwards
from zero for a particular SPI.
Other discoveries
Some reports of this problem on the web note that the
problem is not observed when using a wired connection. I also observed this and
then tried testing a USB wireless adapter – this device did not exhibit the
poor performance behaviour. This lead to the conclusion that the physical
network adapter was an element of the problem rather than a simple
wired/wireless difference.
Another “discovery” (actually a confirmation, since it was
tried after a theory about the cause had been formed) was that restricting the
client to using just one processor (via BIOS settings) eliminated the problem.
Filtering the trace data for interesting ESP sequence number
events often showed something like this:
2021-07-14T08:40:28.1867532Z
FBDD70E2: 233 -> 235 (5928)
2021-07-14T08:40:28.1870094Z FBDD70E2: 235 -> 241 (5928)
2021-07-14T08:40:28.1870119Z FBDD70E2: 241 -> 243 (5928)
2021-07-14T08:40:28.1872059Z FBDD70E2: 243 -> 234 (5892)
2021-07-14T08:40:28.1872088Z FBDD70E2: 234 -> 236 (5892)
2021-07-14T08:40:28.1872338Z FBDD70E2: 240 -> 242 (5892)
2021-07-14T08:40:28.1872361Z FBDD70E2: 242 -> 244 (5892)
The format of the above is timestamp (used to correlate
various views of the trace data), followed by SPI and then the discontinuity in
the sequence numbers and finally the thread ID (in parentheses).
Some of the interesting features of the above trace data are
that some of the “jumps” in the ESP sequence number are quite large (e.g. 9
backwards) and that multiple threads are sending interleaved ESP packets: TID
5928 sends Seq№ 241, TID 5892 sends Seq№ 242 and TID 5928 sends Seq№
243. Either some synchronization mechanism is failing or some prior assumption
has proved wrong.
The use of threads in the problematic case is complicated, so it is
instructive to first see how they are used in the well-behaved case.
Threading in the well-behaved case
To recap the situation, ETW tracing is being performed on a
client that is sending data to the TCP discard port (9). Although the client is
“driving” the interaction (initiating the connection, sending data, etc.), it
is useful to follow the use of threads from the arrival of a packet (probably a
TCP acknowledgement-only packet) to the sending of a response packet (the next
packet of data); often the client is waiting to send (normally because the
congestion window is closed) and the arrival of an acknowledgement triggers the
sending of more data.
When an incoming packet is first detected by the ETW trace,
the stack looks like this:
ndis!PktMonClientNblLogNdis+0x2b
ndis!NdisMIndicateReceiveNetBufferLists+0x3d466
rt640x64.sys+0x1F79B
rt640x64.sys+0x29F9
ndis!ndisInterruptDpc+0x197
nt!KiExecuteAllDpcs+0x30e
nt!KiRetireDpcList+0x1f4
nt!KiIdleLoop+0x9e
rt640x64.sys is the device driver for a “Realtek PCIe GBE
Family Controller” (no symbols available).
Interrupts for a particular device are often directed to a
particular processor and the DPC, queued in the interrupt handling routine,
typically executes on the same processor. When the indication of an incoming
packet reaches AgileVpn.sys (the WAN Miniport driver for IKEv2 VPNs), AgileVpn
dispatches the further processing of the message to one of its worker threads;
the particular worker thread is chosen “deterministically”, using the current processor
number to choose a thread that will run on the same processor.
Most of the subsequent processing (unpacking/decrypting the
ESP packet, indicating the decrypted incoming packet to the VPN interface,
releasing any pending packet that can be sent (congestion control permitting),
encrypting/encapsulating the outgoing packets, etc.) takes place on the same
thread. When the packet re-enters AgileVpn on a transmit path, it is again
handed over to a different AgileVpn worker thread on the same processor
(AgileVpn creates 3 worker threads per processor, for different tasks).
So, in summary (and neglecting the initial interrupt), all
of the activity normally takes place in three threads, all with an affinity for
the same processor. This normally
ensures that IPsec packets are sent in the expected sequence, but it is not a
guarantee (just “good enough”).
Using Performance Monitor to trace the send/indicate
activity per processor during a “discard” test shows this distribution of load:
Threading in the badly-behaved case
Having understood the well-behaved case, the stack when an
incoming packet is first detected by the ETW trace in the badly-behaved case
already suggests the likely cause of the problem:
ndis!PktMonClientNblLogNdis+0x2b
ndis!NdisMIndicateReceiveNetBufferLists+0x3d466
wdiwifi!CPort::IndicateFrames+0x2d8
wdiwifi!CAdapter::IndicateFrames+0x137
wdiwifi!CRxMgr::RxProcessAndIndicateNblChain+0x7f7
wdiwifi!CRxMgr::RxInOrderDataInd+0x35a
wdiwifi!AdapterRxInorderDataInd+0x92
Netwtw06.sys+0x51D13
Netwtw06.sys+0x52201
ndis!ndisDispatchIoWorkItem+0x12
nt!IopProcessWorkItem+0x135
nt!ExpWorkerThread+0x105
nt!PspSystemThreadStartup+0x55
nt!KiStartSystemThread+0x28
The “indication” of the incoming packet (to PktMon and
AgileVpn) does not occur in the context of the device driver DPC routine but
rather in a system worker thread; the device driver DPC routine probably called
NdisQueueIoWorkItem.
NdisAllocateIoWorkItem and NdisQueueIoWorkItem make no
statements (and provide no guarantees) about on which processor the worker
thread will execute. The subsequent handling of the packet is similar to the
well-behaved case (transferring process to an AgileVpn worker thread, etc.)
but, since the initial processor number is essentially chosen at random for
each incoming packet, AgileVpn worker threads on all processors are used.
A “snapshot” of the same Performance Monitor trace as above
looks like this:
I used the word “snapshot” because the distribution of load
varies quite a bit during a test – the essential message is clear though: many
processors are sending packets on the same SPI concurrently and the risk of
disorder in the ESP sequence numbers is clearly present.
TCP CUBIC congestion control
Sending packets out-of-sequence is not ideal (especially if
the degree of disorder approaches the level where ESP Sequence Number
Verification starts to have an effect) but higher level protocols that
guarantee in-sequence delivery (such as TCP, HTTP/3, QUIC, etc.) have
mechanisms for coping with out-of-sequence packets.
In particular TCP, at one level, can handle out-of-sequence
packets easily. However the particular congestion control mechanism used for a
TCP connection can behave badly – and Windows’ current implementation of CUBIC
does behave badly and is the cause of the slow transfer rate.
This is what happens in the “discard” test case:
·
The client sends data bearing TCP packets
out-of-sequence to the server.
·
The server follows normally acknowledgement
policies (e.g. at least one acknowledgement for every two received data
packets) and includes SACKs where appropriate.
·
The client receives the acknowledgements and
sometimes a sequence of acknowledgements for the same sequence number are
received (because the segment that would fill the gap and allow the
acknowledged sequence number to be advanced has not yet arrived at (or just has
not yet been processed) by the server – because it was sent out-of-sequence).
·
The client triggers congestion control
mechanisms, reducing the size of its congestion window and (fast) retransmitting
the “missing” segment.
·
The server receives the duplicate segment and
includes a D-SACK in its next acknowledgement.
·
The client ignores the D-SACK.
In a better CUBIC implementation the client, upon receiving
a D-SACK, would “undo” the congestion window reduction caused by the spurious
retransmission and adjust its parameters for detecting a suspected lost
segment.
Summary and workarounds
A number of factors combine to cause the poor performance.
One element is a network adaptor that uses NdisQueueIoWorkItem, causing the
initial NDIS “indication” of packet arrival to occur on random processors.
Another element is how AgileVpn distributes the load based on the current
processor number rather than, say, SPI (although I don’t know if information
like SPI is available at the time this decision is made). The final element is
the TCP congestion control implementation weaknesses.
There are no good workarounds. Using different network interfaces
(if available) or different VPN protocols (if appropriate/possible) is
obviously possible (but probably an unhelpful suggestion). “Hamstringing” the
system so that it only uses one processor is not something that one could
seriously propose.
Improvements in the TCP congestion control implementation
have been announced but are not available in any mainstream Windows version
yet.