Tuesday, 9 May 2023

Event Tracing for Windows (ETW) Data in Bug Check Secondary Dump Data

Secondary Dump Data seems to be a seldom discussed topic; a useful introduction is the “Inside Show” episode “Bugcheck Secondary Dump Data” by Andrew Richards and Chad Beeder (the main presenters of the “Defrag Tools” shows).

The Secondary Dump Data mechanism can be used by all developers of kernel-mode software (including Microsoft). The information included in the dump is whatever makes sense to the developer, so it can be difficult for someone else to interpret. Microsoft has added some debugger extensions to dump some of their secondary dump data. The table below shows some of the GUIDs used to identify items of secondary dump data and the debugger extension commands that displays them (where known).

GUID Symbol

Debugger Extension Command

mssmbios!SMBiosGuidAcpi

!sysinfo gbl

mssmbios!SMBiosGuidBios

!sysinfo cpuinfo cpuspeed cpumicrocode

mssmbios!SMBiosGuidRegisters

!sysinfo registers

mssmbios!SMBiosGuidSMBios

!sysinfo machineid

nt!EtwSecondaryDumpDataGuid

!wmitrace.strdump !wmitrace.logsave

nt!GUID_TRIAGEDUMP_DATA


nt!PopBlackBoxAcpiGuid

!ext.blackboxacpi

nt!PopBlackBoxBsdGuid

!ext.blackboxbsd

nt!PopBlackBoxCodeIntegrityGuid


nt!PopBlackBoxCrashedProcessGuid

!ext.blackboxcrashedprocess

nt!PopBlackBoxDxgDisplayGuid

!ext.blackboxdxg

nt!PopBlackBoxExplorerCoreStartupGuid


nt!PopBlackBoxExplorerLogonTasksGuid


nt!PopBlackBoxNtfsGuid

!ext.blackboxntfs

nt!PopBlackBoxPdcLockGuid

!ext.blackboxpdclock

nt!PopBlackBoxPnpDelayedRemoveWorkerGuid

!ext.blackboxpnpdelayedremoveworker

nt!PopBlackBoxPnpDeviceCompletionQueueGuid

!ext.blackboxpnpdevicecompletionqueue

nt!PopBlackBoxPnpEventWorkerGuid

!ext.blackboxpnpeventworker

nt!PopBlackBoxPnpGuid

!ext.blackboxpnp

nt!PopBlackBoxPoIrpGuid


nt!PopBlackBoxPoPepWorkOrderGuid

!ext.blackboxpopepworkorder

nt!PopBlackBoxPoPowerWatchdogGuid

!ext.blackboxpowerwatchdog

nt!PopBlackBoxScmGuid


nt!

!ext.blackboxstoremanager

nt!PopBlackBoxUsoCommitGuid


nt!PopBlackBoxWheaGuid


nt!PopBlackBoxWinLogonGuid


nt!PopBlackBoxWinLogonNotifyGuid


pci!PCI_CFG_RECORD_GUID

!pci

Wdf01000!WdfDumpGuid

!wdfkd.wdfcrashdump


The debugger (extension) commands “!rcdrkd.rcdrenumtag” and “.enumtag” show the tags and data included in the secondary dump data “stream” of a dump file.

Of particular interest to me is the EtwSecondaryDumpData; ETW trace sessions started with the flag EVENT_TRACE_ADDTO_TRIAGE_DUMP set in the logging mode will have their “in-memory” trace buffers added to the secondary dump data. On my Windows 11 system, the Microsoft sessions named “EventLog-System”, “Microsoft-Windows-Rdp-Graphics-RdpIdd-Trace” and “WiFiSession” have this flag set, as do some third party sessions (e.g. “IntelRST”).

In principle, trace files for the sessions can be extracted using debugger extension commands; in practice, a few bugs currently make this difficult.

EtwSecondaryDumpData starts with some values that can be used to reconstruct the TRACE_LOGFILE_HEADER of every trace in the system (values for ProviderVersion, TimerResolution, CpuSpeedInMHz,  BootTime and PerfFreq). Following this, for each session that has the EVENT_TRACE_ADDTO_TRIAGE_DUMP flag set, a summary of the WMI_LOGGER_CONTEXT (dt nt!_WMI_LOGGER_CONTEXT) for the session is added to the data, including the “Logger Name”.

In the WMI_LOGGER_CONTEXT structure, LoggerName is a UNICODE_STRING structure. The documentation for the “Length” member of UNICODE_STRING says “Specifies the length, in bytes, of the string pointed to by the Buffer member, not including the terminating NULL character, if any” (my emphasis). Older versions of Windows seem to interpret “Length” as number of Unicode characters (UTF-16) and copy twice the length of the Logger Name to the secondary dump data. The debugger extension “!wmitrace.strdump” follows this example and expects the same (double) length; this works on old secondary dump data but fails silently on secondary dump data of newer Windows versions which copy the correct name length (displays nothing beyond the first session name).

Note that “!wmitrace.strdump” detects whether a dump is a triage dump or a larger dump; if the dump is a triage dump (DUMP_TYPE_TRIAGE) then “!wmitrace.strdump” uses the secondary dump data but, if the dump is larger, then the full kernel WMI_LOGGER_CONTEXT structures are used.

The second bug (at the time of writing) is in the wmitrace routine that reads trace buffers (dt nt!_WMI_BUFFER_HEADER); the routine seems to expect that full buffers will be read (length = WMI_BUFFER_HEADER.BufferSize) although its parameters allow for sections of a buffer to be read. Since the “!wmitrace.logsave” debugger extension tries to read buffer sections, it normally fails.

It was possible to verify that the debugger extensions could work (by debugging the debugger and fixing-up the issues) but, in practice, it is currently more comfortable (and insightful) to re-implement the functionality.

This feature set (marking selected trace sessions with EVENT_TRACE_ADDTO_TRIAGE_DUMP and adding such session trace buffers to triage dumps) is very useful in remote support/diagnostic scenarios where exchanges of full dumps are undesirable (because of confidentiality and size issues) but some contextual/historical information is essential to understand the state of the limited amount of kernel memory in a triage dump.

Note that triage dumps that are not created from a bug check (e.g. triage dumps created by commands such as “kdbgctrl -td <pid> <file>”) do not include secondary dump data.

Event Tracing for Windows (ETW) Data in Bug Check Primary Minidump Data

There is a very limited amount of ETW data in the primary data of a small memory dump (minidump). The debugger extension commands “!wmitrace.dumpmini” and “!wmitrace.dumpminievent” are intended to dump this data; similar to some of the commands previously mentioned, these commands often choose/use one of the 3 “offset” fields in WMI_BUFFER_HEADER which indicates that the buffer is empty. As a workaround, the commands “!wmitrace.buffer poi(nt!KiCurrentEtwBufferBase)” and “!wmitrace.buffer poi(nt!KiCurrentErrLogBufferBase)” give a flavor of the information available.

“!wmitrace.dumpmini” displays the current buffer of the “Circular Kernel Context Logger” session for the current processor – the “used” portion of this buffer is explicitly added to the kernel memory dumped by a small memory dump. “!wmitrace.dumpminievent” displays the current buffer of the “EventLog-System” session if a “current” buffer was identified at the time of the dump (normally there is/was no “current” buffer for this session) and added to the kernel memory dumped.

UPDATE

While thinking about troubleshooting strategies for a problem, I noticed two more secondary dump data items to be interesting for me: nt!GUID_TRIAGEDUMP_DATA and ipt!GUID_IPT.

Triage Dump Data

The “triage dump data” secondary dump data (with GUID nt!GUID_TRIAGEDUMP_DATA) is a relatively simple list of kernel address ranges (base and size) grouped by “component” (a free-form Latin 1 string). This data can be attached to most dump types. In a “large” dump, it indicates which ranges should be added to a “carved” minidump (a minidump created from a larger dump).

The topic that I was thinking about was how to access the buffers that were being used by the Intel Processor Trace (IPT) facility at the time of the crash/dump; the IPT driver adds ranges describing these buffers to the triage dump data (using the component name “IPT”) making them easy to identify. This behaviour also makes it possible to share just carved minidumps when remotely diagnosing a problem and wanting access to the last recorded IPT entries.

Intel Processor Trace (IPT) Data in Bug Check Secondary Dump Data

If IPT is active at the time of a dump (including a “live dump”) then IPT secondary dump data is added to the dump (using the GUID ipt!GUID_IPT). The header of the secondary dump data is an IPT_TRACE structure and two TraceType values appear to be used: one to describe “thread” traces and one to describe “core” traces.

The thread trace secondary data is mostly just a simple summary of the number of threads being traced.

The core trace secondary data is more useful: it contains the kernel address ranges of the trace buffers plus the values of the relevant Intel Model-Specific Registers (MSRs) such as IA32_RTIT_OUTPUT_MASK_PTRS and IA32_RTIT_STATUS.

The usefulness of the trace data is still an open question for me. I have only experimented with the traces in conjunction with a “live” dump and the process of creating the dump is traced, meaning that the trace of the moments before the “dump” will almost certainly be overwritten. It is conceivable that, in the event of crash, the IPT mechanism will be stopped quickly (thus preserving the moments leading up to the crash).


Saturday, 13 August 2022

Analyzing ETW/WPR Intel Processor Trace data from a remote system


As mentioned in a previous posting, a suitably configured WPR/ETW trace (with Loader and ProcessorTrace events) provides most of the information needed to analyse the IPT event data but practical considerations make the availability of a contemporaneous kernel memory dump (almost) a prerequisite for a successful analysis.

The reasons for preferring a memory dump include load-time modifications to the code (especially “Import Optimization”) and the difficulty of managing disassembly of many separate modules (especially for inter-module calls).

I like to help other people troubleshoot their problems and sharing ETW traces is often essential. There are sometimes concerns about the security implications of sharing trace data but sufficiently sophisticated “problem owners” do sometimes share; however, probably in most cases, sharing a (live) kernel memory dump would be considered too difficult/risky.

The approach that I have taken is to create a “dump” file from the information in an ETW data file. The first consideration was how to create a dump containing just selected kernel-mode modules and the first thing that I tested was whether it was possible to load a kernel-mode module in a user-mode process. By “load”, I essentially mean “use LoadLibraryEx”: I knew that it was possible to map any PE module as an “image” using standard file mapping APIs, but I want the ntdll “Ldr” structures to be created so that the “dump” routines would record the kernel module as a loaded module. The documentation for LoadLibraryEx says:

If the specified module is an executable module, static imports are not loaded; instead, the module is loaded as if DONT_RESOLVE_DLL_REFERENCES was specified. See the dwFlags parameter for more information.

In practice “is an executable” means “is not a DLL” (IMAGE_FILE_HEADER. Characteristics does not include IMAGE_FILE_DLL) and many kernel-mode modules are not “DLLs” but some are (fwpkclnt.sys, for example). Therefore, I specify the DONT_RESOLVE_DLL_REFERENCES explicitly to cover such cases (even though the documentation says “Do not use this value; it is provided only for backward compatibility.”).

A quick test of MiniDumpWriteDump verified that a usable dump file could be created with the kernel modules in the loaded modules list. The next step is to apply “import optimization” to the loaded modules. The article Mitigating Spectre variant 2 with Retpoline on Windows describes the process; the only additional “discovery” that I made is that some of the IMAGE_IMPORT_CONTROL_TRANSFER_DYNAMIC_RELOCATION entries contain a value of 0x7FFFF in the IATIndex field (the maximum unsigned 19-bit value), indicating that no optimization should be performed.

It is not necessary, for the intended purpose of IPT data analysis, to perform any other modifications to the loaded image (e.g. apply relocations).

Having loaded the modules and applied import optimization, one is now in a position to create the dump file with MiniDumpWriteDump. I used a DumpType of “MiniDumpWithCodeSegs | MiniDumpWithoutAuxiliaryState”; only the code sections are needed for IPT data analysis and, since I use C#/.NET, the MiniDumpWithoutAuxiliaryState prevents the CLR auxiliary provider from intervening in the dump process. It is not essential, but in order to keep the dump file small and simple, I used the callback types IncludeThreadCallback and IncludeModuleCallback to include just a single thread (to keep debuggers happy) and just the kernel modules.

The resulting dump file still records the kernel modules as being loaded at random user-mode addresses – the final step is to post-process the dump file to relocate them to the locations recorded in the source ETW data. The design of the MiniDumpReadDumpStream API makes this step easy: the routine provides pointers to the key data structures in the mapped view of the dump file – if the file is mapped in a read/write mode then one can just update the values in the structure. We just need to update the MINIDUMP_MODULE.BaseOfImage values for the kernel modules and the MINIDUMP_MEMORY_DESCRIPTOR.StartOfMemoryRange values for memory ranges corresponding to sections of the kernel modules.

Preliminary testing of the hand-crafted dump files has so far revealed only one problem – some system modules still import from HAL.dll although (on my current version of Windows 11) this DLL contains no code and just export forwarders for routines in ntoskrnl.exe. My simple “import optimization” code does not handle this case but as a simple workaround, I just “special case” imports from “HAL.dll” – treating them as direct imports from ntoskrnl.exe.

A suitably configured ETW trace contains enough information to obtain Windows modules (if they are not already locally available), but if the IPT data records paths through third-party modules then these modules will need to be explicitly requested and copied from the “problem owner”.

The “art” of interpreting ETW IPT data

As implied in my original posting on this topic, interpreting ETW IPT data is rather an “art” and, as a side effect, a manual process.

The first step that requires intuition or experience is choosing the events to trace. When one has potentially used the full range of event providers (manifest, WPP, MOF, etc.) to identify “interesting” behaviour, one then has to identify a “SystemProvider” event that occurs shortly afterwards that will trigger logging of the IPT buffer.

Interpreting IPT data is time consuming, so it makes little sense to try to interpret every IPT event in an ETW trace – it is better to select the event(s) with the best chance of being useful. Currently, having identified an IPT event of potential interest in an ETW viewing tool, I copy the IPT data as a hexadecimal string and paste it into a file for analysis.

If a complete dump is not available, then one has to decide which modules to include in a “hand-made” dump file and this might involve retrieving files from the Microsoft Symbol Server. The “first pass” technique that I use to identify the modules to include in a dump is to perform a “quick” analysis of the IPT data – just looking for addresses in TIP and FUP packets. The resulting list of modules containing those addresses might not be complete but a subsequent attempt to fully analyse the IPT data will indicating the next module that needs to be added to the list.

One cannot be certain, on the basis of ETW data alone, whether “import optimization” is in use on a remote system before one starts to analyse the IPT data. If it is not in use then one would need to create a new dump file without import optimization.

Tuesday, 26 July 2022

Intel Processor Trace (IPT) under Windows

My interest in IPT under Windows has been piqued more than once but, until now, my judgement of the effort versus benefit of interpreting IPT data tended to a “not worth it” decision: identifying and displaying the individual IPT packets seemed straightforward enough but interpreting the Taken/Not-taken (TNT) bits would require a disassembler and the binary code and load addresses of all the executable files that might have been executed. Mentions of IPT tracing and trace analysis found in the Web often mention very large volumes of trace data and very long trace analysis times.

The event that prompted a more detailed consideration of the effort required to develop a simple (and therefore slow) tool to analyse very short IPT traces was the discovery that Windows Performance Recorder (WPR) can be configured to cause “IPT” events to be generated as an accompaniment to kernel events. The Windows Performance Recorder Profile (WPRP) schema (https://docs.microsoft.com/en-us/windows-hardware/test/wpt/wprcontrolprofiles-schema) includes a description of the “HardwareCounter” element which can contain elements such as “LastBranch” (for Last Branch Recording (LBR)), “Counters” (for capturing Performance Monitoring Counters (PMC)) and “ProcessorTrace” (for Intel Processor Tracing (IPT)).

The configuration of ProcessorTrace is simple: one just has to specify three items:

  1. The “CodeMode” for the trace (user, kernel or user plus kernel).
  2. The (maximum) “BufferSize” of the IPT trace data (chosen from 4, 8, 16 or 32 kilobytes).
  3. A list of the kernel “Events” that cause a corresponding IPT event to be generated. The events can be chosen from the “SystemStackEnumeration” which is the list of event names that can be used in configuring stack traces for the system provider.

One thing that is missing is an equivalent of the “CustomStack” element for defining custom events, since not all of the kernel events are included in SystemStackEnumeration. A sample configuration could look like this:

<HardwareCounter Id="Perf">

  <ProcessorTrace>

    <BufferSize Value="4" />

    <CodeMode Value="Kernel" />

    <Events>

      <Event Value="SystemCallExit" />

    </Events>

  </ProcessorTrace>

</HardwareCounter>


Starting “small” (smallest buffer size and a single code mode) might be advisable until one has acquired experience in the analysis and interpretation of the data.

Out-of-the-box, there are no MOF classes describing most of the performance events; I added the following definitions for IPT on my system with the “mofcomp” utility:

[dynamic: ToInstance, Guid("{ff1fd2fd-6008-42bb-9e75-00a20051f3be}"), EventVersion(2), DisplayName("IntelProcessorTrace")]

class IPT_V2 : MSNT_SystemTrace
{
}; 

[dynamic: ToInstance, EventType{32}, EventTypeName{"ProcessorTrace"}]
class IPT_Event : IPT_V2
{
    [WmiDataId(1), read] uint64 EventTimeStamp;
    [WmiDataId(2), read] uint32 Process;
    [WmiDataId(3), read] uint32 Thread;
    [WmiDataId(4), read, format("x")] uint64 IptOption;
    [WmiDataId(5), read] uint32 TraceSize;
    [WmiDataId(6), read] uint32 TracePosition;
};

The actual trace data follows immediately after this header; I could not think of a way to include the variable length array of bytes in the MOF class definition.

The first three members are identical in meaning to a kernel stack trace event. A type for the IptOption value is available as a public type in the ipt.sys driver; Windows debuggers display it thus:

0:000> dt ipt!_IPT_OPTION
   +0x000 TraceMode        : Pos 0, 4 Bits
   +0x000 TimeMode         : Pos 4, 4 Bits
   +0x000 MTCFreq          : Pos 8, 4 Bits
   +0x000 CycThresh        : Pos 12, 4 Bits
   +0x000 BufferSize       : Pos 16, 4 Bits
   +0x000 TraceSessionMode : Pos 20, 3 Bits
   +0x000 TraceChild       : Pos 23, 1 Bit
   +0x000 TraceCodeMode    : Pos 24, 4 Bits
   +0x000 Reserved2        : Pos 28, 4 Bits
   +0x004 Reserved3        : Uint4B
   +0x000 Value            : Uint8B 

The TraceSize is the size of the trace data; if the size is less than the configured size, then the “entire” trace is available (all trace data from the last context switch until the triggering event occurred). If TraceSize is equal to the configured “BufferSize” then the trace has probably wrapped and “TracePosition” is the point in the (circular) buffer at which the next packet would have been written; one has to search the buffer in a circular fashion for a PSB (Packet Stream Boundary) packet, starting from the TracePosition.

By including “Loader”keyword events in a WPR trace (which enables loaded modules to be identified, along with their load address), one seems “in good shape” to interpret the IPT trace.

A disassembler is needed to interpret the IPT trace and fortunately one is readily available: the one used by the Windows debuggers, namely the Disassemble method of the IDebugControl interface. The disassembler is needed to identify relevant instructions (e.g. conditional branches) and instruction lengths. The “Disassemble” method does much more than this, formatting the instruction as a string and performing symbol look-up for memory references, so it is slow but it does the job and obviates the need to develop a purpose oriented replacement.

In a typical trace, code from many executable files may appear and the IDebugClient/IDebugControl interfaces is probably not well suited to simultaneously opening several separate executable files. “Fortunately”, I encountered another problem with this approach and the same “solution” resolved both problems.

This code is taken from the executable file; because it contains an indirect control transfer, a TIP (Target IP) would be needed in the IPT trace:

tcpip!TcpDeliverDataToClient+0x119:
call qword ptr [tcpip!_imp_KeAcquireSpinLockAtDpcLevel (00000001`c02331e8)]
nop  dword ptr [rax+rax]
cmp  r14d,0C000021Bh 

However no TIP was present and it turned out that the code in memory that was actually executed looks like this (direct control transfer):

tcpip!TcpDeliverDataToClient+0x119:
mov  r10,qword ptr [tcpip!_imp_KeAcquireSpinLockAtDpcLevel (fffff803`590d31e8)]
call nt!KeAcquireSpinLockAtDpcLevel (fffff803`534a2490)
cmp  r14d,0C000021Bh 

Import Optimization (https://techcommunity.microsoft.com/t5/windows-kernel-internals-blog/mitigating-spectre-variant-2-with-retpoline-on-windows/ba-p/295618) had been applied when building the executable and, whilst there is obviously sufficient metadata in the executable file to recognize and emulate the code modifications, it would be difficult to integrate this into the simple use of the disassembler.

The “solution” was to use a “dump” of the process (or a “live dump” of the kernel) to perform the analysis. This simplifies many things but also means that a standalone ETW (Event Tracing for Windows) file is not enough for an analysis with my simple tool (a dump is needed too).

The “conciseness” of the IPT trace data means that it is not easy to “check” whether an analysis is proceeding correctly. One of my many mistakes was in incorrectly handling “Indirect Transfer Compression for Returns” (the uncompressed cases), but “RET compression” was a big help in identifying problems: if a RET was compressed, then the Taken/Not-taken bit should be set and if it is clear then one knows that something has gone wrong. Another hint is if the “recorded” code path does not seem plausible; this is not always easy to judge, but I often found that my tool was analyzing the routine “KeBugCheckEx” – something that had patently not happened during the trace capture.

My “use case” for IPT tracing is as an additional aid in debugging/troubleshooting tricky/interesting problems. For this type of tracing to be useful, one needs to identify kernel events that occur after the code of interest has been executed and whose IPT data might include the path taken. The limited set of events in SystemStackEnumeration (lacking, for example, network events) is a hindrance, but the undocumented API to set additional custom events is relatively easy to deduce. IPT trace data attached to the “CSwitch” event is often useful; some traces are very short (a context switch from idle) and are useful for testing the TNT interpreter and some others are useful “backstops” for data gathering (especially if the context switch is the result of a natural “break” in execution, such as entering a wait state).

\Device\IPT IOCTL Interface

IPT can be used separately from ETW: the ipt.sys driver makes certain IPT operations available via an IOCTL style interface. This interface is not documented, but the ipt.sys driver is small and “straightforward”, so many of the features of the interface can be deduced. As someone who is almost exclusively interested in short IPT, it is a relief that the interface supports some of the IPT filtering mechanisms – most importantly filtering by IP (Instruction Pointer).

The current (undocumented and probably still evolving) interface allows IPT tracing to be enabled for a process and IP filtering to be configured per thread. Once tracing has been enabled for a process (which enables tracing on all threads in the process), tracing of individual threads can be suspended and resumed and IP filtering can be applied to individual threads. Threads created after tracing has started inherit the tracing options set for the process but start without any IP filtering.

I am often interested in tracing the path through short sections of code in service processes, where the thread which will execute the code cannot easily be predicted and might even be a newly created thread. I wanted to avoid “invading” the process to be traced (by attaching a “debugger”), but that is the only standard way of being informed of (and partially controlling) thread creation in a process. Initially, I thought that this would be simple: just receive the debug events, apply the IPT IP filter to any newly created threads and then resume the target. However applying an IPT IP filter to a thread that has just been created and is paused at the create thread debug event has no effect – it is necessary to arrange for the thread to proceed to the “LdrInitializeThunk” routine before applying the filter.

Most of the IPT tracing configurable via IOCTL traces to circular buffers; these buffers can be large and, with judicious filtering, they might not need to wrap. There is one operation that writes the trace data directly to a file, ensuring a complete trace; this operation just traces the user mode behaviour of a process and does not support IP filtering.

Summary

I am often interested with problems related to networking (for example, a potential minor problem in the Windows Filtering Platform, described in an earlier posting) and the frequently used troubleshooting tools are event tracing (including network packet) and user-mode debugging. Kernel debugging is possible but I use it only very occasionally (partly because disturbing the timing of things in the debugger disturbs the whole evolution of the debugging scenario). IPT tracing will hopefully be useful, when it can be applied. Often the “transmit” side of communication occurs in a predictable process (and a process for which a “handle” can be obtained) and here process based tracing can be effectively deployed. However, the “receive” side can occur in any context/process and I hope that combining ETW and IPT will help there. There are also common scenarios where the “transmissions” originate from the “System” process (e.g. SMB traffic) and the IOCTL interface, which uses handles rather than process ids to identify the target, can’t be used there.

Sunday, 10 April 2022

Windows Filtering Platform and Window Service Hardening Rules

The Windows Filtering Platform (WFP) is an important Windows system component that I had only ever endeavoured to understand in sufficient depth to meet current needs.

The Microsoft documentation says: “Windows Filtering Platform (WFP) performs its tasks by integrating the following basic entities: Layers, Filters, Shims, and Callouts.”

Use (and management) of rules in Windows Defender Firewall required an understanding of WFP filters; interpreting the data captured by Microsoft Message Analyser benefitted from understanding WFP layers and callouts; experimenting with IPsec, VPN and DirectAccess benefitted from understanding WFP layers, callouts and provider contexts.

One aspect of WFP that I dismissed/ignored as just a grouping mechanism was WFP sublayers; their role in classification and filter arbitration is described in the Microsoft documentation, but I never previously read this closely enough.

I wrote about Network Discovery last year and was surprised and embarrassed when I noticed that the list of discovered computers under Windows 11 was incomplete for reasons that I could not explain – the local computer (which had previously always been in the list) was not present. Initially, I just quickly dismissed this as a “by design” decision until I noticed a correlation between the process of network discovery and WFP packet drop events. Here is the output of the “netsh wfp show netevents” command for the drop event:

<header>
       <timeStamp>2022-04-09T09:14:32.144Z</timeStamp>
       <flags numItems="9">
              <item>FWPM_NET_EVENT_FLAG_IP_PROTOCOL_SET</item>
              <item>FWPM_NET_EVENT_FLAG_LOCAL_ADDR_SET</item>
              <item>FWPM_NET_EVENT_FLAG_REMOTE_ADDR_SET</item>
              <item>FWPM_NET_EVENT_FLAG_LOCAL_PORT_SET</item>
              <item>FWPM_NET_EVENT_FLAG_REMOTE_PORT_SET</item>
              <item>FWPM_NET_EVENT_FLAG_APP_ID_SET</item>
              <item>FWPM_NET_EVENT_FLAG_USER_ID_SET</item>
              <item>FWPM_NET_EVENT_FLAG_IP_VERSION_SET</item>
              <item>FWPM_NET_EVENT_FLAG_PACKAGE_ID_SET</item>
       </flags>
       <ipVersion>FWP_IP_VERSION_V6</ipVersion>
       <ipProtocol>17</ipProtocol>
       <localAddrV6.byteArray16>::1</localAddrV6.byteArray16>
       <remoteAddrV6.byteArray16>::1</remoteAddrV6.byteArray16>
       <localPort>50602</localPort>
       <remotePort>3702</remotePort>
       <scopeId>0</scopeId>
       <appId>
       <data>5c006400650076006900630065005c0068006100720064006400690073006b0076006f006c0075006d00650033005c00770069006e0064006f00770073005c00730079007300740065006d00330032005c0073007600630068006f00730074002e006500780065000000</data>
       <asString>\.d.e.v.i.c.e.\.h.a.r.d.d.i.s.k.v.o.l.u.m.e.3.\.w.i.n.d.o.w.s.\.s.y.s.t.e.m.3.2.\.s.v.c.h.o.s.t...e.x.e...</asString>
       </appId>
       <userId>S-1-5-19</userId>
       <addressFamily>FWP_AF_INET6</addressFamily>
       <packageSid>S-1-0-0</packageSid>
       <enterpriseId/>
       <policyFlags>0</policyFlags>
       <effectiveName/>
</header>
<type>FWPM_NET_EVENT_TYPE_PUBLIC_CLASSIFY_DROP</type>
<classifyDrop>
       <filterId>69067</filterId>
       <layerId>46</layerId>
       <reauthReason>0</reauthReason>
       <originalProfile>0</originalProfile>
       <currentProfile>0</currentProfile>
       <msFwpDirection>MS_FWP_DIRECTION_OUT</msFwpDirection>
       <isLoopback>true</isLoopback>
       <vSwitchId/>
       <vSwitchSourcePort>0</vSwitchSourcePort>
       <vSwitchDestinationPort>0</vSwitchDestinationPort>
</classifyDrop>
<internalFields>
       <internalFlags numItems="1">
              <item>FWPM_NET_EVENT_INTERNAL_FLAG_FILTER_ORIGIN_SET</item>
       </internalFlags>
       <capabilities/>
       <fqbnVersion>0</fqbnVersion>
       <fqbnName/>
       <terminatingFiltersInfo numItems="4">
              <item>
                     <filterId>67000</filterId>
                     <subLayer>FWPP_SUBLAYER_INTERNAL_FIREWALL_APP_ISOLATION</subLayer>
                     <actionType>FWP_ACTION_PERMIT</actionType>
              </item>
              <item>
                     <filterId>66827</filterId>
                     <subLayer>FWPP_SUBLAYER_INTERNAL_FIREWALL_QUARANTINE</subLayer>
                     <actionType>FWP_ACTION_PERMIT</actionType>
              </item>
              <item>
                     <filterId>69067</filterId>
                     <subLayer>FWPP_SUBLAYER_INTERNAL_FIREWALL_WSH</subLayer>
                     <actionType>FWP_ACTION_BLOCK</actionType>
              </item>
              <item>
                     <filterId>66219</filterId>
                     <subLayer>FWPP_SUBLAYER_INTERNAL_FIREWALL_WF</subLayer>
                     <actionType>FWP_ACTION_PERMIT</actionType>
              </item>
       </terminatingFiltersInfo>
       <filterOrigin>WSH Default</filterOrigin>
       <interfaceLuid>6755399457832960</interfaceLuid>
</internalFields>

The section highlighted in yellow was new to me and particularly intriguing was the “terminatingFiltersInfo” data. It only became clear later that what this showed was all of the sublayers in layer 46 (FWPS_LAYER_ALE_AUTH_RECV_ACCEPT_V6) that contained one or more filters that matched the packet. Within each sublayer the filters are evaluated and the filter that delivers the “terminating” action (based on filter weight, action, rights, etc. as discussed in the Filter Arbitration documentation) for that sublayer is reported.

Comparing the filters of Windows 10 and 11 systems gave part of the answer why the local computer was missing from the list of computers. The equivalent for the terminating filter for the FWPP_SUBLAYER_INTERNAL_FIREWALL_APP_ISOLATION sublayer in Windows 11 (named “AppContainerLoopback”) is defined in the FWPM_SUBLAYER_MPSSVC_WSH sublayer under Windows 10. The (blocking) terminating filter in the FWPP_SUBLAYER_INTERNAL_FIREWALL_WSH sublayer is named “WSH Default Inbound Block”.

This means that in Windows 10, the “AppContainerLoopback” filter can (and does, via weighting) override the “WSH Default Inbound Block” filter because they are in the same sublayer; this is not true for Windows 11.

This change of sublayer for the “AppContainerLoopback” loopback filter explains the difference in behaviour between Windows 10 and 11 but still leaves a mystery: there are 7 WSH rules/filters for the “Function Discovery Provider Host” (fdphost) service and one, named “Allow inbound UDP traffic to fdphost port 3702”, is possibly intended to allow responses to the WS-Discovery multicast probes to be received.

Some more detailed tracing is needed to form a hypothesis for this behaviour. The trace command that I used was:

pktmon start --trace --provider Microsoft-Windows-WFP --provider Microsoft-Windows-TCPIP --keywords 0x300408080 --level 17 --provider "TCPIP Service Trace" --keywords 0x17100 --level 6 --file-name why.etl

Provider Microsoft-Windows-WFP is an obvious choice and the Microsoft-Windows-TCPIP provider with the keywords ut:TcpipDiagnosis, ut:AleRemoteEndpoint, ut:Loopback, ut:SendPath, ut:ReceivePath limits the (verbose) output of that provider to the more relevant events. These two providers give background information about what is happening at any particular time and the "TCPIP Service Trace" with keywords WFP_TRACE_BASE, WFP_TRACE_FE, WFP_TRACE_STM, WFP_TRACE_ALE, NETIO_TRACE_TUNNEL provides the details.

"TCPIP Service Trace" is a WPP (Windows Software Trace Preprocessor) provider, so its data is difficult to interpret without the corresponding private .pdb file. Here is an indication of the type of information in the trace data:

This shows the packet being sent, no existing flow found and each of the filters in the layer being tested against the packet:


The data made available to the filters is also logged, as is the final result:


Once the packet has passed the outbound filters, one can see that the packet is looped back and inbound filtering is started:


Finally, one can see that the packet is dropped:


The filter responsible for the drop (“WSH Default Inbound Block”) only has one filter condition and that is a match against FWPM_CONDITION_ALE_USER_ID. The information used for this condition is a self-relative TOKEN_ACCESS_INFORMATION structure and this is included in the trace (as a binary blob).

Formatting that blob shows something like this:

SidHash Offset 0x58
SidHash 0x00000000 S-1-5-19
SidHash 0x00000060 S-1-16-16384
SidHash 0x00000007 S-1-1-0
SidHash 0x00000007 S-1-5-32-545
SidHash 0x00000007 S-1-5-6
SidHash 0x00000007 S-1-2-1
SidHash 0x00000007 S-1-5-11
SidHash 0x00000007 S-1-5-15
SidHash 0x0000000E S-1-5-80-364023826-931424190-487969545-1024119571-74567675
SidHash 0xC000000F S-1-5-5-0-11718649
SidHash 0x00000007 S-1-2-0
SidHash 0x00000007 S-1-5-32-3167453650-624722384-889205278-321484983-714554697-3592933102-807660695-1632717421
SidHash 0x00000007 S-1-5-32-383293015-3350740429-1839969850-1819881064-1569454686-4198502490-78857879-1413643331
SidHash 0x00000007 S-1-5-32-2035927579-283314533-3422103930-3587774809-765962649-3034203285-3544878962-607181067
SidHash 0x00000007 S-1-5-32-3659434007-2290108278-1125199667-3679670526-1293081662-2164323352-1777701501-2595986263
SidHash 0x00000007 S-1-5-32-11742800-2107441976-3443185924-4134956905-3840447964-3749968454-3843513199-670971053
SidHash 0x00000007 S-1-5-32-3523901360-1745872541-794127107-675934034-1867954868-1951917511-1111796624-2052600462
SidHash 0x00000007 S-1-5-32-1488445330-856673777-1515413738-1380768593-2977925950-2228326386-886087428-2802422674
RestrictedSidHash Offset 0x4A0
Privileges Offset 0x800
Privilege 0x00000003 0x0000000000000017
Privilege 0x00000003 0x000000000000001D
AuthenticationId 0x3E5
TokenType TokenPrimary
ImpersonationLevel SecurityAnonymous
MandatoryPolicy NO_WRITE_UP, NEW_PROCESS_MIN
Flags 0x1002800
AppContainerNumber 0
CapabilitiesHash Offset 0x5B0
SecurityAttributes Offset 0x6C0
SecurityAttributes Name="TSA://ProcUnique" Type=2 Flags=0x0 Count=2 X1=0x41
  Value[0]=245
  Value[1]=11718747
 

The S-1-5-80 (service SID) is the service SID of the receiving process (“fdphost” (Function Discovery Provider Host)).

fdphost sends a WS-Discovery probe to a multicast address and UDP port 3702, but it sends the probe from its randomly assigned local port number; replies to the probes are sent back to this port number. Non-loopback replies are permitted by an ALE multicast flow but, for currently unknown reasons, loopback replies are subjected to a full “classification” – which results in a drop decision. My hypothesis is that no attempt is made to match loopback packets against existing ALE multicast flows.

I searched the web for mentions of the local system not appearing in the list of discovered computers and found none. I also asked on the Microsoft Q&A website and received one report that the issue did not appear to be present – so the hypothesis is unconfirmed (or even “in doubt”) at the moment…

Sunday, 9 January 2022

Windows 11 TCP/IP Congestion Control Improvements

I have written about weaknesses in the Windows 10 TCP/IP CUBIC congestion control mechanism in both this blog (Slow performance of IKEv2 built-in client VPN under Windows) and in a number of threads in the Microsoft Q&A site (that typically mention slow upload speed only under Windows (good speed under other OSes)); I also mentioned some links that suggested improvements were under development.

The improvements did not surface in any mainstream Windows 10 version of which I am aware; however Windows 11 does seem to incorporate substantial changes (at least an improved RFC 8985 (The RACK-TLP Loss Detection Algorithm for TCP) implementation with per-segment tracking), albeit with a least one minor bug which still limits performance (the bug is still present in Windows 11 build 22000.376).

The “bug” that I am referring to is a “sanity check” in the routine TcpReceiveSack. The problematic check is that if the SACK SLE (SACK Left Edge) is less than the acknowledgement (i.e. appears to be a D-SACK) then the SACK SRE (SACK Right Edge) must also be less than the acknowledgement; this appears to be coded incorrectly and means that genuine D-SACKs are not recognized as such. This failure to recognize D-SACKs means that tuning of things such as the “reorder window” does not take place.

The initial size of the “reorder window” (RACK.reo_wnd) is RACK.min_RTT/4 and it can grow to a maximum size of SRTT (Smoothed Round Trip Time). For many configurations and degrees of packet reordering, the default size eliminates many unnecessary retransmisions. However, in my test configuration (TCP inside an IKEv2 tunnel between two systems on the same LAN with substantial reordering introduced by the network adapter driver and a very low min_RTT (less than one millisecond)), the default reorder window size is completely inadequate.

A one-byte patch to tcpip.sys can (more or less) “correct” this problem (the patch does not handle sequence number wrap-around), enabling performance tests with and without the patch to be performed. This patching is risky (it will eventually result in a bug check when the change is detected by PatchGuard), but I judged the value of the performance test results to be worth the inconvenience.

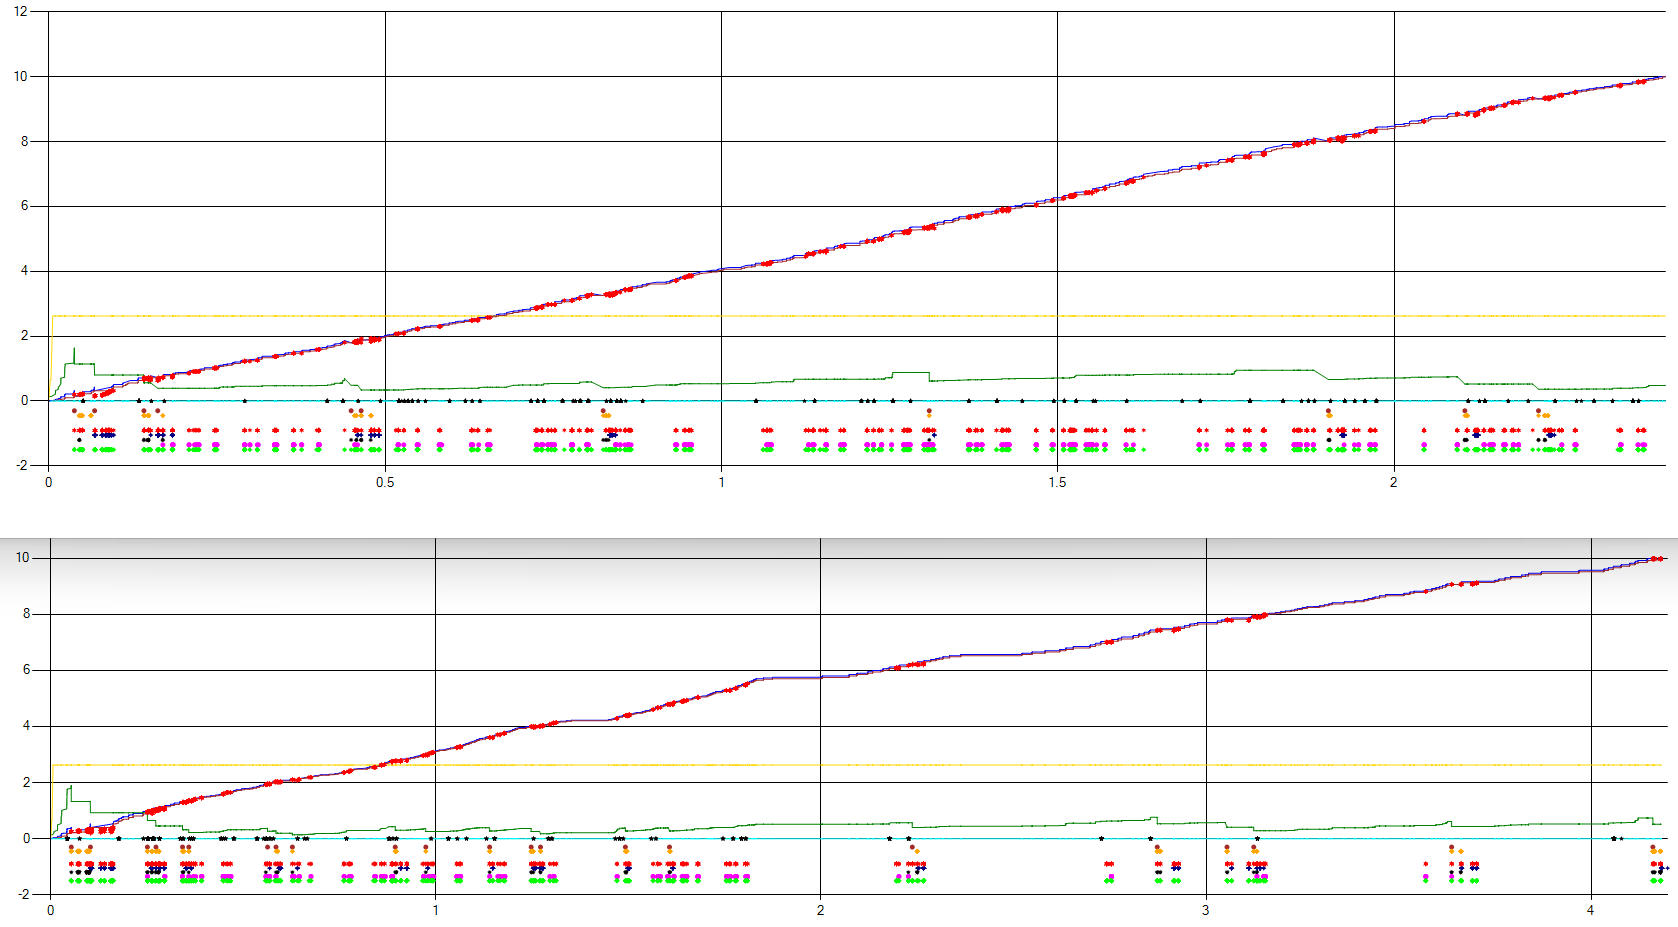
What follows are traces of two 10 MB “discards” (TCP port 9), with and without the patch:


With the patch (above), the 10 MB discard takes about 2.4 seconds and, without the patch (below), it takes about 4.2 seconds.

The green line (the congestion window size) is reduced more without the patch, although there is less “reordering” than in the patched test. The yellow line is the send window size (auto-tuned by the server) and is indeed approximately the minimum window size needed to achieve the theoretical maximum throughput.

The dots on and below the x-axis are points at which “interesting” events occur; from the x-axis downwards:

·         Packet reordering

·         TcpEarlyRetransmit (Forward ACK (FACK), Recent ACK (RACK))

·         TcpLossRecoverySend Fast Retransmit

·         TcpLossRecoverySend SACK Retransmit

·         TcpDataTransferRetransmit

·         TcpTcbExpireTimer

·         D-SACK

·         TcpSendTrackerDetectLoss

·         TcpSendTrackerSackReorderingDetected

·         TcpSendTrackerUpdateReoWnd

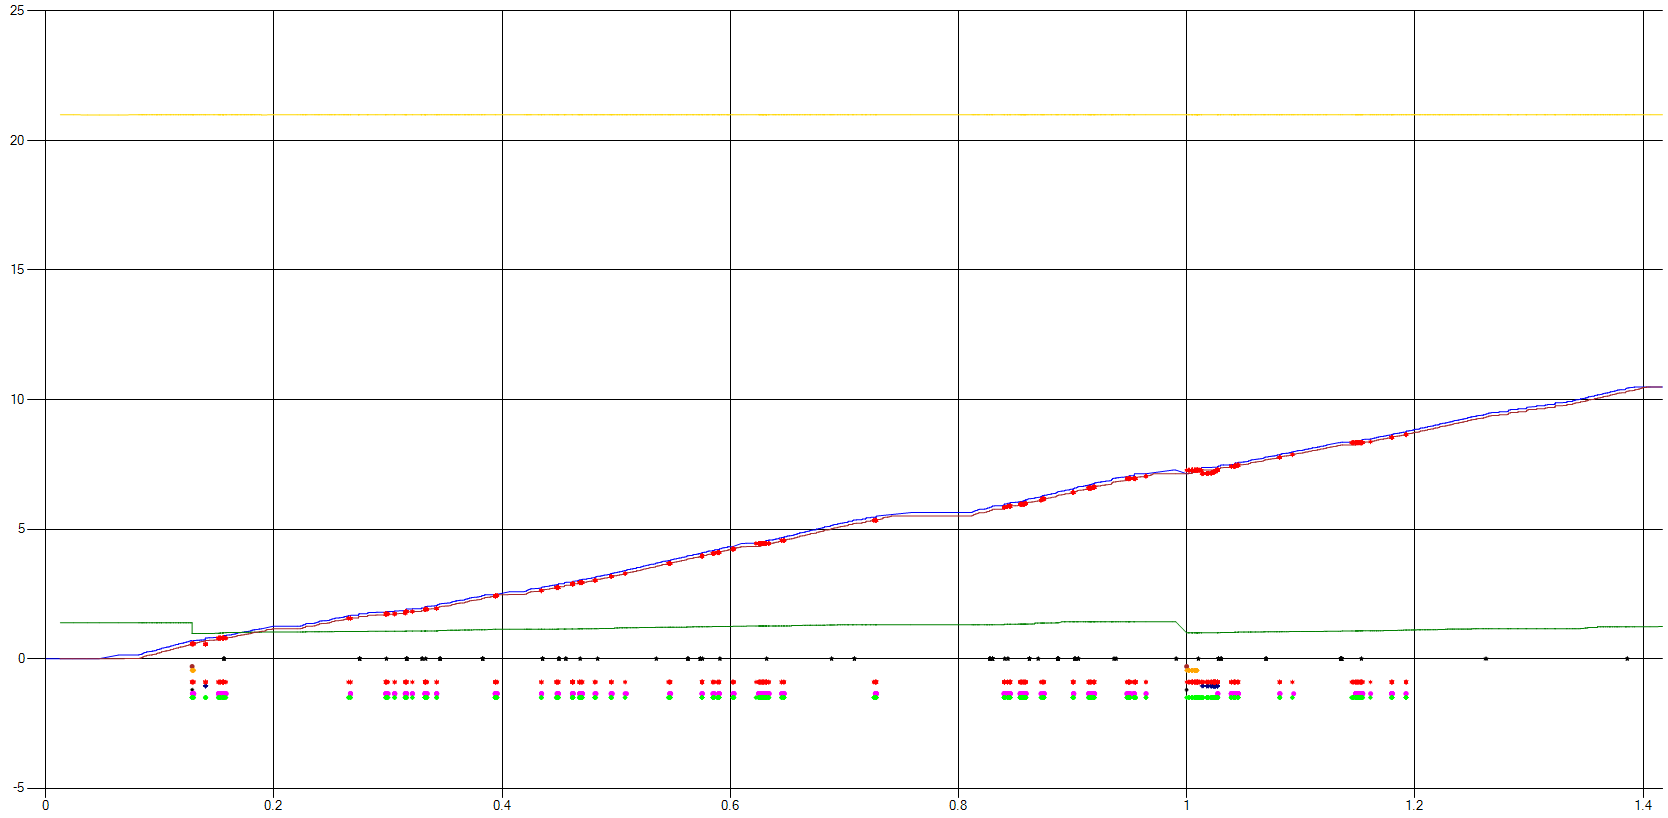
A graph of the Windows 11 trace data gathered by someone with a “real world” setup (minimum RTT of about 9 milliseconds and using SMB file copy to generate the traffic) and no patching looks like this:


In this case, the initial reordering window was large enough to allow almost all reordering to be detected (and therefore to avoid spurious retransmissions).

The trace where D-SACK recognition is working shows that congestion window reduction following a retransmission is not “undone” in the case that a D-SACK shows the retransmission to have been spurious; this may mean that Windows 11 will not perform as well as some other operating systems when sending TCP data over a path where some packet reordering is present.

There are two Microsoft-Windows-TCPIP events that indicated whether D-SACKs are being recognized. In the TcpReceiveSack event, there is a DSackCount member that accurately reflects the number of D-SACKs (as observed in the raw packet data) when D-SACK recognition is working. In the TcpSendTrackerUpdateReoWnd event, there are several members that reflect the state of the RACK algorithm: Multiplier (RACK.reo_wnd_mult), Persist (RACK.reo_wnd_persist), Reownd (RACK.reo_wnd), ReorderingSeen (RACK.reordering_seen), DSackSeenOnLastAck, DSackRound/DSackRoundValid (RACK.dsack_round); when D-SACK recognition is working and D-SACKs are present then this event contains meaningful data.

October 2022 Update: Windows 11 22H2 corrects the D-SACK recognition problem.


Wednesday, 14 July 2021

Slow performance of IKEv2 built-in client VPN under Windows


I noticed over time several reports in technical forums of slow IKEv2 performance, with the observed performance often being quoted as just 10% to 20% of the expected performance; troubleshooting network performance problems almost always requires making network traces and, on the few occasions that I offered to help with the analysis, there was an (understandable) unwillingness to share trace data. When someone agreed to share the data, the analysis proved to be trickier than expected.

The first network trace

The first trace used a combination of two ETW providers: Microsoft-Windows-PktMon (with keywords 0x10) and Microsoft-Windows-TCPIP (with keywords 0x200500000020 and level 16). I had used this combination before when troubleshooting problems with the TCP CUBIC congestion algorithm and out-of-sequence delivery of TCP packets (see here) and developed a simple tool to visualize interesting aspects of the captured data. This is what the tool showed:


The blue line is the TCP send sequence number; the green line is the size of the congestion window (not to scale on the Y-axis – it is its shape that is most interesting); the yellow line is the send window (to same scale as congestion window).

At 6 arbitrary Y-values, points are shown when “interesting” events occur; the events are:

·         TcpEarlyRetransmit

·         TcpLossRecoverySend Fast Retransmit

·         TcpLossRecoverySend SACK Retransmit

·         TcpDataTransferRetransmit

·         TcpTcbExpireTimer RetransmitTimer

·         D-SACK [RFC3708] arrival

 The black points on the horizontal access indicate when IPsec ESP sequence numbers are detected “out-of-sequence”. In contrast to the other data and events, which all refer to the same TCP connection, this information is not necessarily related to the same TCP connection but is “circumstantially” related. The reason for this is that it is difficult to know what is “inside” a particular ESP packet; by combining information from several ETW providers, it is often possible to infer what is inside, but that is not essential for this visualization tool – the temporal relationship between events often “suggests” whether a (causal) link possibly exists.

The traffic being measured in the trace/graph is 10 back-to-back sends of a one megabyte block to the “discard” port on the “server”, so there is no application protocol hand-shaking or other overheads.

I had initially expected to see something like a fragmentation problem, but the graph looked exactly like the TCP CUBIC out-of-sequence behaviour. This was surprising because the client and server were on the same network, which made it unlikely that network equipment was causing the disorder in the packet sequencing.

For comparison purposes, this is what the visualization of a “good” transfer looks like:


The first surprise

A more detailed look at the trace data revealed that data carrying (large) ESP packets were leaving the sender with the ESP sequence numbers sometimes “disordered”. The ESP RFC 2406 describes the generation and verification of sequence numbers and one would certainly expect the transmitted sequence numbers to just monotonically count upwards from zero for a particular SPI.

Other discoveries

Some reports of this problem on the web note that the problem is not observed when using a wired connection. I also observed this and then tried testing a USB wireless adapter – this device did not exhibit the poor performance behaviour. This lead to the conclusion that the physical network adapter was an element of the problem rather than a simple wired/wireless difference.

Another “discovery” (actually a confirmation, since it was tried after a theory about the cause had been formed) was that restricting the client to using just one processor (via BIOS settings) eliminated the problem.

Filtering the trace data for interesting ESP sequence number events often showed something like this:

2021-07-14T08:40:28.1867532Z FBDD70E2: 233 -> 235 (5928)
2021-07-14T08:40:28.1870094Z FBDD70E2: 235 -> 241 (5928)
2021-07-14T08:40:28.1870119Z FBDD70E2: 241 -> 243 (5928)
2021-07-14T08:40:28.1872059Z FBDD70E2: 243 -> 234 (5892)
2021-07-14T08:40:28.1872088Z FBDD70E2: 234 -> 236 (5892)
2021-07-14T08:40:28.1872338Z FBDD70E2: 240 -> 242 (5892)
2021-07-14T08:40:28.1872361Z FBDD70E2: 242 -> 244 (5892)

The format of the above is timestamp (used to correlate various views of the trace data), followed by SPI and then the discontinuity in the sequence numbers and finally the thread ID (in parentheses).

Some of the interesting features of the above trace data are that some of the “jumps” in the ESP sequence number are quite large (e.g. 9 backwards) and that multiple threads are sending interleaved ESP packets: TID 5928 sends Seq№ 241, TID 5892 sends Seq№ 242 and TID 5928 sends Seq№ 243. Either some synchronization mechanism is failing or some prior assumption has proved wrong.

The use of threads in the problematic case is complicated, so it is instructive to first see how they are used in the well-behaved case.

Threading in the well-behaved case

To recap the situation, ETW tracing is being performed on a client that is sending data to the TCP discard port (9). Although the client is “driving” the interaction (initiating the connection, sending data, etc.), it is useful to follow the use of threads from the arrival of a packet (probably a TCP acknowledgement-only packet) to the sending of a response packet (the next packet of data); often the client is waiting to send (normally because the congestion window is closed) and the arrival of an acknowledgement triggers the sending of more data.

When an incoming packet is first detected by the ETW trace, the stack looks like this:

ndis!PktMonClientNblLogNdis+0x2b
ndis!NdisMIndicateReceiveNetBufferLists+0x3d466
rt640x64.sys+0x1F79B
rt640x64.sys+0x29F9
ndis!ndisInterruptDpc+0x197
nt!KiExecuteAllDpcs+0x30e
nt!KiRetireDpcList+0x1f4
nt!KiIdleLoop+0x9e

rt640x64.sys is the device driver for a “Realtek PCIe GBE Family Controller” (no symbols available).

Interrupts for a particular device are often directed to a particular processor and the DPC, queued in the interrupt handling routine, typically executes on the same processor. When the indication of an incoming packet reaches AgileVpn.sys (the WAN Miniport driver for IKEv2 VPNs), AgileVpn dispatches the further processing of the message to one of its worker threads; the particular worker thread is chosen “deterministically”, using the current processor number to choose a thread that will run on the same processor.

Most of the subsequent processing (unpacking/decrypting the ESP packet, indicating the decrypted incoming packet to the VPN interface, releasing any pending packet that can be sent (congestion control permitting), encrypting/encapsulating the outgoing packets, etc.) takes place on the same thread. When the packet re-enters AgileVpn on a transmit path, it is again handed over to a different AgileVpn worker thread on the same processor (AgileVpn creates 3 worker threads per processor, for different tasks).

So, in summary (and neglecting the initial interrupt), all of the activity normally takes place in three threads, all with an affinity for the same processor. This normally ensures that IPsec packets are sent in the expected sequence, but it is not a guarantee (just “good enough”).

Using Performance Monitor to trace the send/indicate activity per processor during a “discard” test shows this distribution of load:


Threading in the badly-behaved case

Having understood the well-behaved case, the stack when an incoming packet is first detected by the ETW trace in the badly-behaved case already suggests the likely cause of the problem:

ndis!PktMonClientNblLogNdis+0x2b
ndis!NdisMIndicateReceiveNetBufferLists+0x3d466
wdiwifi!CPort::IndicateFrames+0x2d8
wdiwifi!CAdapter::IndicateFrames+0x137
wdiwifi!CRxMgr::RxProcessAndIndicateNblChain+0x7f7
wdiwifi!CRxMgr::RxInOrderDataInd+0x35a
wdiwifi!AdapterRxInorderDataInd+0x92
Netwtw06.sys+0x51D13
Netwtw06.sys+0x52201
ndis!ndisDispatchIoWorkItem+0x12
nt!IopProcessWorkItem+0x135
nt!ExpWorkerThread+0x105
nt!PspSystemThreadStartup+0x55
nt!KiStartSystemThread+0x28

The “indication” of the incoming packet (to PktMon and AgileVpn) does not occur in the context of the device driver DPC routine but rather in a system worker thread; the device driver DPC routine probably called NdisQueueIoWorkItem.

NdisAllocateIoWorkItem and NdisQueueIoWorkItem make no statements (and provide no guarantees) about on which processor the worker thread will execute. The subsequent handling of the packet is similar to the well-behaved case (transferring process to an AgileVpn worker thread, etc.) but, since the initial processor number is essentially chosen at random for each incoming packet, AgileVpn worker threads on all processors are used.

A “snapshot” of the same Performance Monitor trace as above looks like this:


I used the word “snapshot” because the distribution of load varies quite a bit during a test – the essential message is clear though: many processors are sending packets on the same SPI concurrently and the risk of disorder in the ESP sequence numbers is clearly present.

TCP CUBIC congestion control

Sending packets out-of-sequence is not ideal (especially if the degree of disorder approaches the level where ESP Sequence Number Verification starts to have an effect) but higher level protocols that guarantee in-sequence delivery (such as TCP, HTTP/3, QUIC, etc.) have mechanisms for coping with out-of-sequence packets.

In particular TCP, at one level, can handle out-of-sequence packets easily. However the particular congestion control mechanism used for a TCP connection can behave badly – and Windows’ current implementation of CUBIC does behave badly and is the cause of the slow transfer rate.

This is what happens in the “discard” test case:

·         The client sends data bearing TCP packets out-of-sequence to the server.

·         The server follows normally acknowledgement policies (e.g. at least one acknowledgement for every two received data packets) and includes SACKs where appropriate.

·         The client receives the acknowledgements and sometimes a sequence of acknowledgements for the same sequence number are received (because the segment that would fill the gap and allow the acknowledged sequence number to be advanced has not yet arrived at (or just has not yet been processed) by the server – because it was sent out-of-sequence).

·         The client triggers congestion control mechanisms, reducing the size of its congestion window and (fast) retransmitting the “missing” segment.

·         The server receives the duplicate segment and includes a D-SACK in its next acknowledgement.

·         The client ignores the D-SACK.

In a better CUBIC implementation the client, upon receiving a D-SACK, would “undo” the congestion window reduction caused by the spurious retransmission and adjust its parameters for detecting a suspected lost segment.

Summary and workarounds

A number of factors combine to cause the poor performance. One element is a network adaptor that uses NdisQueueIoWorkItem, causing the initial NDIS “indication” of packet arrival to occur on random processors. Another element is how AgileVpn distributes the load based on the current processor number rather than, say, SPI (although I don’t know if information like SPI is available at the time this decision is made). The final element is the TCP congestion control implementation weaknesses.

There are no good workarounds. Using different network interfaces (if available) or different VPN protocols (if appropriate/possible) is obviously possible (but probably an unhelpful suggestion). “Hamstringing” the system so that it only uses one processor is not something that one could seriously propose.

Improvements in the TCP congestion control implementation have been announced but are not available in any mainstream Windows version yet.