Saturday 13 August 2022

Analyzing ETW/WPR Intel Processor Trace data from a remote system


As mentioned in a previous posting, a suitably configured WPR/ETW trace (with Loader and ProcessorTrace events) provides most of the information needed to analyse the IPT event data but practical considerations make the availability of a contemporaneous kernel memory dump (almost) a prerequisite for a successful analysis.

The reasons for preferring a memory dump include load-time modifications to the code (especially “Import Optimization”) and the difficulty of managing disassembly of many separate modules (especially for inter-module calls).

I like to help other people troubleshoot their problems and sharing ETW traces is often essential. There are sometimes concerns about the security implications of sharing trace data but sufficiently sophisticated “problem owners” do sometimes share; however, probably in most cases, sharing a (live) kernel memory dump would be considered too difficult/risky.

The approach that I have taken is to create a “dump” file from the information in an ETW data file. The first consideration was how to create a dump containing just selected kernel-mode modules and the first thing that I tested was whether it was possible to load a kernel-mode module in a user-mode process. By “load”, I essentially mean “use LoadLibraryEx”: I knew that it was possible to map any PE module as an “image” using standard file mapping APIs, but I want the ntdll “Ldr” structures to be created so that the “dump” routines would record the kernel module as a loaded module. The documentation for LoadLibraryEx says:

If the specified module is an executable module, static imports are not loaded; instead, the module is loaded as if DONT_RESOLVE_DLL_REFERENCES was specified. See the dwFlags parameter for more information.

In practice “is an executable” means “is not a DLL” (IMAGE_FILE_HEADER. Characteristics does not include IMAGE_FILE_DLL) and many kernel-mode modules are not “DLLs” but some are (fwpkclnt.sys, for example). Therefore, I specify the DONT_RESOLVE_DLL_REFERENCES explicitly to cover such cases (even though the documentation says “Do not use this value; it is provided only for backward compatibility.”).

A quick test of MiniDumpWriteDump verified that a usable dump file could be created with the kernel modules in the loaded modules list. The next step is to apply “import optimization” to the loaded modules. The article Mitigating Spectre variant 2 with Retpoline on Windows describes the process; the only additional “discovery” that I made is that some of the IMAGE_IMPORT_CONTROL_TRANSFER_DYNAMIC_RELOCATION entries contain a value of 0x7FFFF in the IATIndex field (the maximum unsigned 19-bit value), indicating that no optimization should be performed.

It is not necessary, for the intended purpose of IPT data analysis, to perform any other modifications to the loaded image (e.g. apply relocations).

Having loaded the modules and applied import optimization, one is now in a position to create the dump file with MiniDumpWriteDump. I used a DumpType of “MiniDumpWithCodeSegs | MiniDumpWithoutAuxiliaryState”; only the code sections are needed for IPT data analysis and, since I use C#/.NET, the MiniDumpWithoutAuxiliaryState prevents the CLR auxiliary provider from intervening in the dump process. It is not essential, but in order to keep the dump file small and simple, I used the callback types IncludeThreadCallback and IncludeModuleCallback to include just a single thread (to keep debuggers happy) and just the kernel modules.

The resulting dump file still records the kernel modules as being loaded at random user-mode addresses – the final step is to post-process the dump file to relocate them to the locations recorded in the source ETW data. The design of the MiniDumpReadDumpStream API makes this step easy: the routine provides pointers to the key data structures in the mapped view of the dump file – if the file is mapped in a read/write mode then one can just update the values in the structure. We just need to update the MINIDUMP_MODULE.BaseOfImage values for the kernel modules and the MINIDUMP_MEMORY_DESCRIPTOR.StartOfMemoryRange values for memory ranges corresponding to sections of the kernel modules.

Preliminary testing of the hand-crafted dump files has so far revealed only one problem – some system modules still import from HAL.dll although (on my current version of Windows 11) this DLL contains no code and just export forwarders for routines in ntoskrnl.exe. My simple “import optimization” code does not handle this case but as a simple workaround, I just “special case” imports from “HAL.dll” – treating them as direct imports from ntoskrnl.exe.

A suitably configured ETW trace contains enough information to obtain Windows modules (if they are not already locally available), but if the IPT data records paths through third-party modules then these modules will need to be explicitly requested and copied from the “problem owner”.

The “art” of interpreting ETW IPT data

As implied in my original posting on this topic, interpreting ETW IPT data is rather an “art” and, as a side effect, a manual process.

The first step that requires intuition or experience is choosing the events to trace. When one has potentially used the full range of event providers (manifest, WPP, MOF, etc.) to identify “interesting” behaviour, one then has to identify a “SystemProvider” event that occurs shortly afterwards that will trigger logging of the IPT buffer.

Interpreting IPT data is time consuming, so it makes little sense to try to interpret every IPT event in an ETW trace – it is better to select the event(s) with the best chance of being useful. Currently, having identified an IPT event of potential interest in an ETW viewing tool, I copy the IPT data as a hexadecimal string and paste it into a file for analysis.

If a complete dump is not available, then one has to decide which modules to include in a “hand-made” dump file and this might involve retrieving files from the Microsoft Symbol Server. The “first pass” technique that I use to identify the modules to include in a dump is to perform a “quick” analysis of the IPT data – just looking for addresses in TIP and FUP packets. The resulting list of modules containing those addresses might not be complete but a subsequent attempt to fully analyse the IPT data will indicating the next module that needs to be added to the list.

One cannot be certain, on the basis of ETW data alone, whether “import optimization” is in use on a remote system before one starts to analyse the IPT data. If it is not in use then one would need to create a new dump file without import optimization.

Tuesday 26 July 2022

Intel Processor Trace (IPT) under Windows

My interest in IPT under Windows has been piqued more than once but, until now, my judgement of the effort versus benefit of interpreting IPT data tended to a “not worth it” decision: identifying and displaying the individual IPT packets seemed straightforward enough but interpreting the Taken/Not-taken (TNT) bits would require a disassembler and the binary code and load addresses of all the executable files that might have been executed. Mentions of IPT tracing and trace analysis found in the Web often mention very large volumes of trace data and very long trace analysis times.

The event that prompted a more detailed consideration of the effort required to develop a simple (and therefore slow) tool to analyse very short IPT traces was the discovery that Windows Performance Recorder (WPR) can be configured to cause “IPT” events to be generated as an accompaniment to kernel events. The Windows Performance Recorder Profile (WPRP) schema (https://docs.microsoft.com/en-us/windows-hardware/test/wpt/wprcontrolprofiles-schema) includes a description of the “HardwareCounter” element which can contain elements such as “LastBranch” (for Last Branch Recording (LBR)), “Counters” (for capturing Performance Monitoring Counters (PMC)) and “ProcessorTrace” (for Intel Processor Tracing (IPT)).

The configuration of ProcessorTrace is simple: one just has to specify three items:

  1. The “CodeMode” for the trace (user, kernel or user plus kernel).
  2. The (maximum) “BufferSize” of the IPT trace data (chosen from 4, 8, 16 or 32 kilobytes).
  3. A list of the kernel “Events” that cause a corresponding IPT event to be generated. The events can be chosen from the “SystemStackEnumeration” which is the list of event names that can be used in configuring stack traces for the system provider.

One thing that is missing is an equivalent of the “CustomStack” element for defining custom events, since not all of the kernel events are included in SystemStackEnumeration. A sample configuration could look like this:

<HardwareCounter Id="Perf">

  <ProcessorTrace>

    <BufferSize Value="4" />

    <CodeMode Value="Kernel" />

    <Events>

      <Event Value="SystemCallExit" />

    </Events>

  </ProcessorTrace>

</HardwareCounter>


Starting “small” (smallest buffer size and a single code mode) might be advisable until one has acquired experience in the analysis and interpretation of the data.

Out-of-the-box, there are no MOF classes describing most of the performance events; I added the following definitions for IPT on my system with the “mofcomp” utility:

[dynamic: ToInstance, Guid("{ff1fd2fd-6008-42bb-9e75-00a20051f3be}"), EventVersion(2), DisplayName("IntelProcessorTrace")]

class IPT_V2 : MSNT_SystemTrace
{
}; 

[dynamic: ToInstance, EventType{32}, EventTypeName{"ProcessorTrace"}]
class IPT_Event : IPT_V2
{
    [WmiDataId(1), read] uint64 EventTimeStamp;
    [WmiDataId(2), read] uint32 Process;
    [WmiDataId(3), read] uint32 Thread;
    [WmiDataId(4), read, format("x")] uint64 IptOption;
    [WmiDataId(5), read] uint32 TraceSize;
    [WmiDataId(6), read] uint32 TracePosition;
};

The actual trace data follows immediately after this header; I could not think of a way to include the variable length array of bytes in the MOF class definition.

The first three members are identical in meaning to a kernel stack trace event. A type for the IptOption value is available as a public type in the ipt.sys driver; Windows debuggers display it thus:

0:000> dt ipt!_IPT_OPTION
   +0x000 TraceMode        : Pos 0, 4 Bits
   +0x000 TimeMode         : Pos 4, 4 Bits
   +0x000 MTCFreq          : Pos 8, 4 Bits
   +0x000 CycThresh        : Pos 12, 4 Bits
   +0x000 BufferSize       : Pos 16, 4 Bits
   +0x000 TraceSessionMode : Pos 20, 3 Bits
   +0x000 TraceChild       : Pos 23, 1 Bit
   +0x000 TraceCodeMode    : Pos 24, 4 Bits
   +0x000 Reserved2        : Pos 28, 4 Bits
   +0x004 Reserved3        : Uint4B
   +0x000 Value            : Uint8B 

The TraceSize is the size of the trace data; if the size is less than the configured size, then the “entire” trace is available (all trace data from the last context switch until the triggering event occurred). If TraceSize is equal to the configured “BufferSize” then the trace has probably wrapped and “TracePosition” is the point in the (circular) buffer at which the next packet would have been written; one has to search the buffer in a circular fashion for a PSB (Packet Stream Boundary) packet, starting from the TracePosition.

By including “Loader”keyword events in a WPR trace (which enables loaded modules to be identified, along with their load address), one seems “in good shape” to interpret the IPT trace.

A disassembler is needed to interpret the IPT trace and fortunately one is readily available: the one used by the Windows debuggers, namely the Disassemble method of the IDebugControl interface. The disassembler is needed to identify relevant instructions (e.g. conditional branches) and instruction lengths. The “Disassemble” method does much more than this, formatting the instruction as a string and performing symbol look-up for memory references, so it is slow but it does the job and obviates the need to develop a purpose oriented replacement.

In a typical trace, code from many executable files may appear and the IDebugClient/IDebugControl interfaces is probably not well suited to simultaneously opening several separate executable files. “Fortunately”, I encountered another problem with this approach and the same “solution” resolved both problems.

This code is taken from the executable file; because it contains an indirect control transfer, a TIP (Target IP) would be needed in the IPT trace:

tcpip!TcpDeliverDataToClient+0x119:
call qword ptr [tcpip!_imp_KeAcquireSpinLockAtDpcLevel (00000001`c02331e8)]
nop  dword ptr [rax+rax]
cmp  r14d,0C000021Bh 

However no TIP was present and it turned out that the code in memory that was actually executed looks like this (direct control transfer):

tcpip!TcpDeliverDataToClient+0x119:
mov  r10,qword ptr [tcpip!_imp_KeAcquireSpinLockAtDpcLevel (fffff803`590d31e8)]
call nt!KeAcquireSpinLockAtDpcLevel (fffff803`534a2490)
cmp  r14d,0C000021Bh 

Import Optimization (https://techcommunity.microsoft.com/t5/windows-kernel-internals-blog/mitigating-spectre-variant-2-with-retpoline-on-windows/ba-p/295618) had been applied when building the executable and, whilst there is obviously sufficient metadata in the executable file to recognize and emulate the code modifications, it would be difficult to integrate this into the simple use of the disassembler.

The “solution” was to use a “dump” of the process (or a “live dump” of the kernel) to perform the analysis. This simplifies many things but also means that a standalone ETW (Event Tracing for Windows) file is not enough for an analysis with my simple tool (a dump is needed too).

The “conciseness” of the IPT trace data means that it is not easy to “check” whether an analysis is proceeding correctly. One of my many mistakes was in incorrectly handling “Indirect Transfer Compression for Returns” (the uncompressed cases), but “RET compression” was a big help in identifying problems: if a RET was compressed, then the Taken/Not-taken bit should be set and if it is clear then one knows that something has gone wrong. Another hint is if the “recorded” code path does not seem plausible; this is not always easy to judge, but I often found that my tool was analyzing the routine “KeBugCheckEx” – something that had patently not happened during the trace capture.

My “use case” for IPT tracing is as an additional aid in debugging/troubleshooting tricky/interesting problems. For this type of tracing to be useful, one needs to identify kernel events that occur after the code of interest has been executed and whose IPT data might include the path taken. The limited set of events in SystemStackEnumeration (lacking, for example, network events) is a hindrance, but the undocumented API to set additional custom events is relatively easy to deduce. IPT trace data attached to the “CSwitch” event is often useful; some traces are very short (a context switch from idle) and are useful for testing the TNT interpreter and some others are useful “backstops” for data gathering (especially if the context switch is the result of a natural “break” in execution, such as entering a wait state).

\Device\IPT IOCTL Interface

IPT can be used separately from ETW: the ipt.sys driver makes certain IPT operations available via an IOCTL style interface. This interface is not documented, but the ipt.sys driver is small and “straightforward”, so many of the features of the interface can be deduced. As someone who is almost exclusively interested in short IPT, it is a relief that the interface supports some of the IPT filtering mechanisms – most importantly filtering by IP (Instruction Pointer).

The current (undocumented and probably still evolving) interface allows IPT tracing to be enabled for a process and IP filtering to be configured per thread. Once tracing has been enabled for a process (which enables tracing on all threads in the process), tracing of individual threads can be suspended and resumed and IP filtering can be applied to individual threads. Threads created after tracing has started inherit the tracing options set for the process but start without any IP filtering.

I am often interested in tracing the path through short sections of code in service processes, where the thread which will execute the code cannot easily be predicted and might even be a newly created thread. I wanted to avoid “invading” the process to be traced (by attaching a “debugger”), but that is the only standard way of being informed of (and partially controlling) thread creation in a process. Initially, I thought that this would be simple: just receive the debug events, apply the IPT IP filter to any newly created threads and then resume the target. However applying an IPT IP filter to a thread that has just been created and is paused at the create thread debug event has no effect – it is necessary to arrange for the thread to proceed to the “LdrInitializeThunk” routine before applying the filter.

Most of the IPT tracing configurable via IOCTL traces to circular buffers; these buffers can be large and, with judicious filtering, they might not need to wrap. There is one operation that writes the trace data directly to a file, ensuring a complete trace; this operation just traces the user mode behaviour of a process and does not support IP filtering.

Summary

I am often interested with problems related to networking (for example, a potential minor problem in the Windows Filtering Platform, described in an earlier posting) and the frequently used troubleshooting tools are event tracing (including network packet) and user-mode debugging. Kernel debugging is possible but I use it only very occasionally (partly because disturbing the timing of things in the debugger disturbs the whole evolution of the debugging scenario). IPT tracing will hopefully be useful, when it can be applied. Often the “transmit” side of communication occurs in a predictable process (and a process for which a “handle” can be obtained) and here process based tracing can be effectively deployed. However, the “receive” side can occur in any context/process and I hope that combining ETW and IPT will help there. There are also common scenarios where the “transmissions” originate from the “System” process (e.g. SMB traffic) and the IOCTL interface, which uses handles rather than process ids to identify the target, can’t be used there.

Sunday 10 April 2022

Windows Filtering Platform and Window Service Hardening Rules

The Windows Filtering Platform (WFP) is an important Windows system component that I had only ever endeavoured to understand in sufficient depth to meet current needs.

The Microsoft documentation says: “Windows Filtering Platform (WFP) performs its tasks by integrating the following basic entities: LayersFiltersShims, and Callouts.”

Use (and management) of rules in Windows Defender Firewall required an understanding of WFP filters; interpreting the data captured by Microsoft Message Analyser benefitted from understanding WFP layers and callouts; experimenting with IPsec, VPN and DirectAccess benefitted from understanding WFP layers, callouts and provider contexts.

One aspect of WFP that I dismissed/ignored as just a grouping mechanism was WFP sublayers; their role in classification and filter arbitration is described in the Microsoft documentation, but I never previously read this closely enough.

I wrote about Network Discovery last year and was surprised and embarrassed when I noticed that the list of discovered computers under Windows 11 was incomplete for reasons that I could not explain – the local computer (which had previously always been in the list) was not present. Initially, I just quickly dismissed this as a “by design” decision until I noticed a correlation between the process of network discovery and WFP packet drop events. Here is the output of the “netsh wfp show netevents” command for the drop event:

<header>
       <timeStamp>2022-04-09T09:14:32.144Z</timeStamp>
       <flags numItems="9">
              <item>FWPM_NET_EVENT_FLAG_IP_PROTOCOL_SET</item>
              <item>FWPM_NET_EVENT_FLAG_LOCAL_ADDR_SET</item>
              <item>FWPM_NET_EVENT_FLAG_REMOTE_ADDR_SET</item>
              <item>FWPM_NET_EVENT_FLAG_LOCAL_PORT_SET</item>
              <item>FWPM_NET_EVENT_FLAG_REMOTE_PORT_SET</item>
              <item>FWPM_NET_EVENT_FLAG_APP_ID_SET</item>
              <item>FWPM_NET_EVENT_FLAG_USER_ID_SET</item>
              <item>FWPM_NET_EVENT_FLAG_IP_VERSION_SET</item>
              <item>FWPM_NET_EVENT_FLAG_PACKAGE_ID_SET</item>
       </flags>
       <ipVersion>FWP_IP_VERSION_V6</ipVersion>
       <ipProtocol>17</ipProtocol>
       <localAddrV6.byteArray16>::1</localAddrV6.byteArray16>
       <remoteAddrV6.byteArray16>::1</remoteAddrV6.byteArray16>
       <localPort>50602</localPort>
       <remotePort>3702</remotePort>
       <scopeId>0</scopeId>
       <appId>
       <data>5c006400650076006900630065005c0068006100720064006400690073006b0076006f006c0075006d00650033005c00770069006e0064006f00770073005c00730079007300740065006d00330032005c0073007600630068006f00730074002e006500780065000000</data>
       <asString>\.d.e.v.i.c.e.\.h.a.r.d.d.i.s.k.v.o.l.u.m.e.3.\.w.i.n.d.o.w.s.\.s.y.s.t.e.m.3.2.\.s.v.c.h.o.s.t...e.x.e...</asString>
       </appId>
       <userId>S-1-5-19</userId>
       <addressFamily>FWP_AF_INET6</addressFamily>
       <packageSid>S-1-0-0</packageSid>
       <enterpriseId/>
       <policyFlags>0</policyFlags>
       <effectiveName/>
</header>
<type>FWPM_NET_EVENT_TYPE_PUBLIC_CLASSIFY_DROP</type>
<classifyDrop>
       <filterId>69067</filterId>
       <layerId>46</layerId>
       <reauthReason>0</reauthReason>
       <originalProfile>0</originalProfile>
       <currentProfile>0</currentProfile>
       <msFwpDirection>MS_FWP_DIRECTION_OUT</msFwpDirection>
       <isLoopback>true</isLoopback>
       <vSwitchId/>
       <vSwitchSourcePort>0</vSwitchSourcePort>
       <vSwitchDestinationPort>0</vSwitchDestinationPort>
</classifyDrop>
<internalFields>
       <internalFlags numItems="1">
              <item>FWPM_NET_EVENT_INTERNAL_FLAG_FILTER_ORIGIN_SET</item>
       </internalFlags>
       <capabilities/>
       <fqbnVersion>0</fqbnVersion>
       <fqbnName/>
       <terminatingFiltersInfo numItems="4">
              <item>
                     <filterId>67000</filterId>
                     <subLayer>FWPP_SUBLAYER_INTERNAL_FIREWALL_APP_ISOLATION</subLayer>
                     <actionType>FWP_ACTION_PERMIT</actionType>
              </item>
              <item>
                     <filterId>66827</filterId>
                     <subLayer>FWPP_SUBLAYER_INTERNAL_FIREWALL_QUARANTINE</subLayer>
                     <actionType>FWP_ACTION_PERMIT</actionType>
              </item>
              <item>
                     <filterId>69067</filterId>
                     <subLayer>FWPP_SUBLAYER_INTERNAL_FIREWALL_WSH</subLayer>
                     <actionType>FWP_ACTION_BLOCK</actionType>
              </item>
              <item>
                     <filterId>66219</filterId>
                     <subLayer>FWPP_SUBLAYER_INTERNAL_FIREWALL_WF</subLayer>
                     <actionType>FWP_ACTION_PERMIT</actionType>
              </item>
       </terminatingFiltersInfo>
       <filterOrigin>WSH Default</filterOrigin>
       <interfaceLuid>6755399457832960</interfaceLuid>
</internalFields>

The section highlighted in yellow was new to me and particularly intriguing was the “terminatingFiltersInfo” data. It only became clear later that what this showed was all of the sublayers in layer 46 (FWPS_LAYER_ALE_AUTH_RECV_ACCEPT_V6) that contained one or more filters that matched the packet. Within each sublayer the filters are evaluated and the filter that delivers the “terminating” action (based on filter weight, action, rights, etc. as discussed in the Filter Arbitration documentation) for that sublayer is reported.

Comparing the filters of Windows 10 and 11 systems gave part of the answer why the local computer was missing from the list of computers. The equivalent for the terminating filter for the FWPP_SUBLAYER_INTERNAL_FIREWALL_APP_ISOLATION sublayer in Windows 11 (named “AppContainerLoopback”) is defined in the FWPM_SUBLAYER_MPSSVC_WSH sublayer under Windows 10. The (blocking) terminating filter in the FWPP_SUBLAYER_INTERNAL_FIREWALL_WSH sublayer is named “WSH Default Inbound Block”.

This means that in Windows 10, the “AppContainerLoopback” filter can (and does, via weighting) override the “WSH Default Inbound Block” filter because they are in the same sublayer; this is not true for Windows 11.

This change of sublayer for the “AppContainerLoopback” loopback filter explains the difference in behaviour between Windows 10 and 11 but still leaves a mystery: there are 7 WSH rules/filters for the “Function Discovery Provider Host” (fdphost) service and one, named “Allow inbound UDP traffic to fdphost port 3702”, is possibly intended to allow responses to the WS-Discovery multicast probes to be received.

Some more detailed tracing is needed to form a hypothesis for this behaviour. The trace command that I used was:

pktmon start --trace --provider Microsoft-Windows-WFP --provider Microsoft-Windows-TCPIP --keywords 0x300408080 --level 17 --provider "TCPIP Service Trace" --keywords 0x17100 --level 6 --file-name why.etl

Provider Microsoft-Windows-WFP is an obvious choice and the Microsoft-Windows-TCPIP provider with the keywords ut:TcpipDiagnosis, ut:AleRemoteEndpoint, ut:Loopback, ut:SendPath, ut:ReceivePath limits the (verbose) output of that provider to the more relevant events. These two providers give background information about what is happening at any particular time and the "TCPIP Service Trace" with keywords WFP_TRACE_BASE, WFP_TRACE_FE, WFP_TRACE_STM, WFP_TRACE_ALE, NETIO_TRACE_TUNNEL provides the details.

"TCPIP Service Trace" is a WPP (Windows Software Trace Preprocessor) provider, so its data is difficult to interpret without the corresponding private .pdb file. Here is an indication of the type of information in the trace data:

This shows the packet being sent, no existing flow found and each of the filters in the layer being tested against the packet:


The data made available to the filters is also logged, as is the final result:


Once the packet has passed the outbound filters, one can see that the packet is looped back and inbound filtering is started:


Finally, one can see that the packet is dropped:


The filter responsible for the drop (“WSH Default Inbound Block”) only has one filter condition and that is a match against FWPM_CONDITION_ALE_USER_ID. The information used for this condition is a self-relative TOKEN_ACCESS_INFORMATION structure and this is included in the trace (as a binary blob).

Formatting that blob shows something like this:

SidHash Offset 0x58
SidHash 0x00000000 S-1-5-19
SidHash 0x00000060 S-1-16-16384
SidHash 0x00000007 S-1-1-0
SidHash 0x00000007 S-1-5-32-545
SidHash 0x00000007 S-1-5-6
SidHash 0x00000007 S-1-2-1
SidHash 0x00000007 S-1-5-11
SidHash 0x00000007 S-1-5-15
SidHash 0x0000000E S-1-5-80-364023826-931424190-487969545-1024119571-74567675
SidHash 0xC000000F S-1-5-5-0-11718649
SidHash 0x00000007 S-1-2-0
SidHash 0x00000007 S-1-5-32-3167453650-624722384-889205278-321484983-714554697-3592933102-807660695-1632717421
SidHash 0x00000007 S-1-5-32-383293015-3350740429-1839969850-1819881064-1569454686-4198502490-78857879-1413643331
SidHash 0x00000007 S-1-5-32-2035927579-283314533-3422103930-3587774809-765962649-3034203285-3544878962-607181067
SidHash 0x00000007 S-1-5-32-3659434007-2290108278-1125199667-3679670526-1293081662-2164323352-1777701501-2595986263
SidHash 0x00000007 S-1-5-32-11742800-2107441976-3443185924-4134956905-3840447964-3749968454-3843513199-670971053
SidHash 0x00000007 S-1-5-32-3523901360-1745872541-794127107-675934034-1867954868-1951917511-1111796624-2052600462
SidHash 0x00000007 S-1-5-32-1488445330-856673777-1515413738-1380768593-2977925950-2228326386-886087428-2802422674
RestrictedSidHash Offset 0x4A0
Privileges Offset 0x800
Privilege 0x00000003 0x0000000000000017
Privilege 0x00000003 0x000000000000001D
AuthenticationId 0x3E5
TokenType TokenPrimary
ImpersonationLevel SecurityAnonymous
MandatoryPolicy NO_WRITE_UP, NEW_PROCESS_MIN
Flags 0x1002800
AppContainerNumber 0
CapabilitiesHash Offset 0x5B0
SecurityAttributes Offset 0x6C0
SecurityAttributes Name="TSA://ProcUnique" Type=2 Flags=0x0 Count=2 X1=0x41
  Value[0]=245
  Value[1]=11718747
 

The S-1-5-80 (service SID) is the service SID of the receiving process (“fdphost” (Function Discovery Provider Host)).

fdphost sends a WS-Discovery probe to a multicast address and UDP port 3702, but it sends the probe from its randomly assigned local port number; replies to the probes are sent back to this port number. Non-loopback replies are permitted by an ALE multicast flow but, for currently unknown reasons, loopback replies are subjected to a full “classification” – which results in a drop decision. My hypothesis is that no attempt is made to match loopback packets against existing ALE multicast flows.

I searched the web for mentions of the local system not appearing in the list of discovered computers and found none. I also asked on the Microsoft Q&A website and received one report that the issue did not appear to be present – so the hypothesis is unconfirmed (or even “in doubt”) at the moment…

Sunday 9 January 2022

Windows 11 TCP/IP Congestion Control Improvements

I have written about weaknesses in the Windows 10 TCP/IP CUBIC congestion control mechanism in both this blog (Slow performance of IKEv2 built-in client VPN under Windows) and in a number of threads in the Microsoft Q&A site (that typically mention slow upload speed only under Windows (good speed under other OSes)); I also mentioned some links that suggested improvements were under development.

The improvements did not surface in any mainstream Windows 10 version of which I am aware; however Windows 11 does seem to incorporate substantial changes (at least an improved RFC 8985 (The RACK-TLP Loss Detection Algorithm for TCP) implementation with per-segment tracking), albeit with a least one minor bug which still limits performance (the bug is still present in Windows 11 build 22000.376).

The “bug” that I am referring to is a “sanity check” in the routine TcpReceiveSack. The problematic check is that if the SACK SLE (SACK Left Edge) is less than the acknowledgement (i.e. appears to be a D-SACK) then the SACK SRE (SACK Right Edge) must also be less than the acknowledgement; this appears to be coded incorrectly and means that genuine D-SACKs are not recognized as such. This failure to recognize D-SACKs means that tuning of things such as the “reorder window” does not take place.

The initial size of the “reorder window” (RACK.reo_wnd) is RACK.min_RTT/4 and it can grow to a maximum size of SRTT (Smoothed Round Trip Time). For many configurations and degrees of packet reordering, the default size eliminates many unnecessary retransmisions. However, in my test configuration (TCP inside an IKEv2 tunnel between two systems on the same LAN with substantial reordering introduced by the network adapter driver and a very low min_RTT (less than one millisecond)), the default reorder window size is completely inadequate.

A one-byte patch to tcpip.sys can (more or less) “correct” this problem (the patch does not handle sequence number wrap-around), enabling performance tests with and without the patch to be performed. This patching is risky (it will eventually result in a bug check when the change is detected by PatchGuard), but I judged the value of the performance test results to be worth the inconvenience.

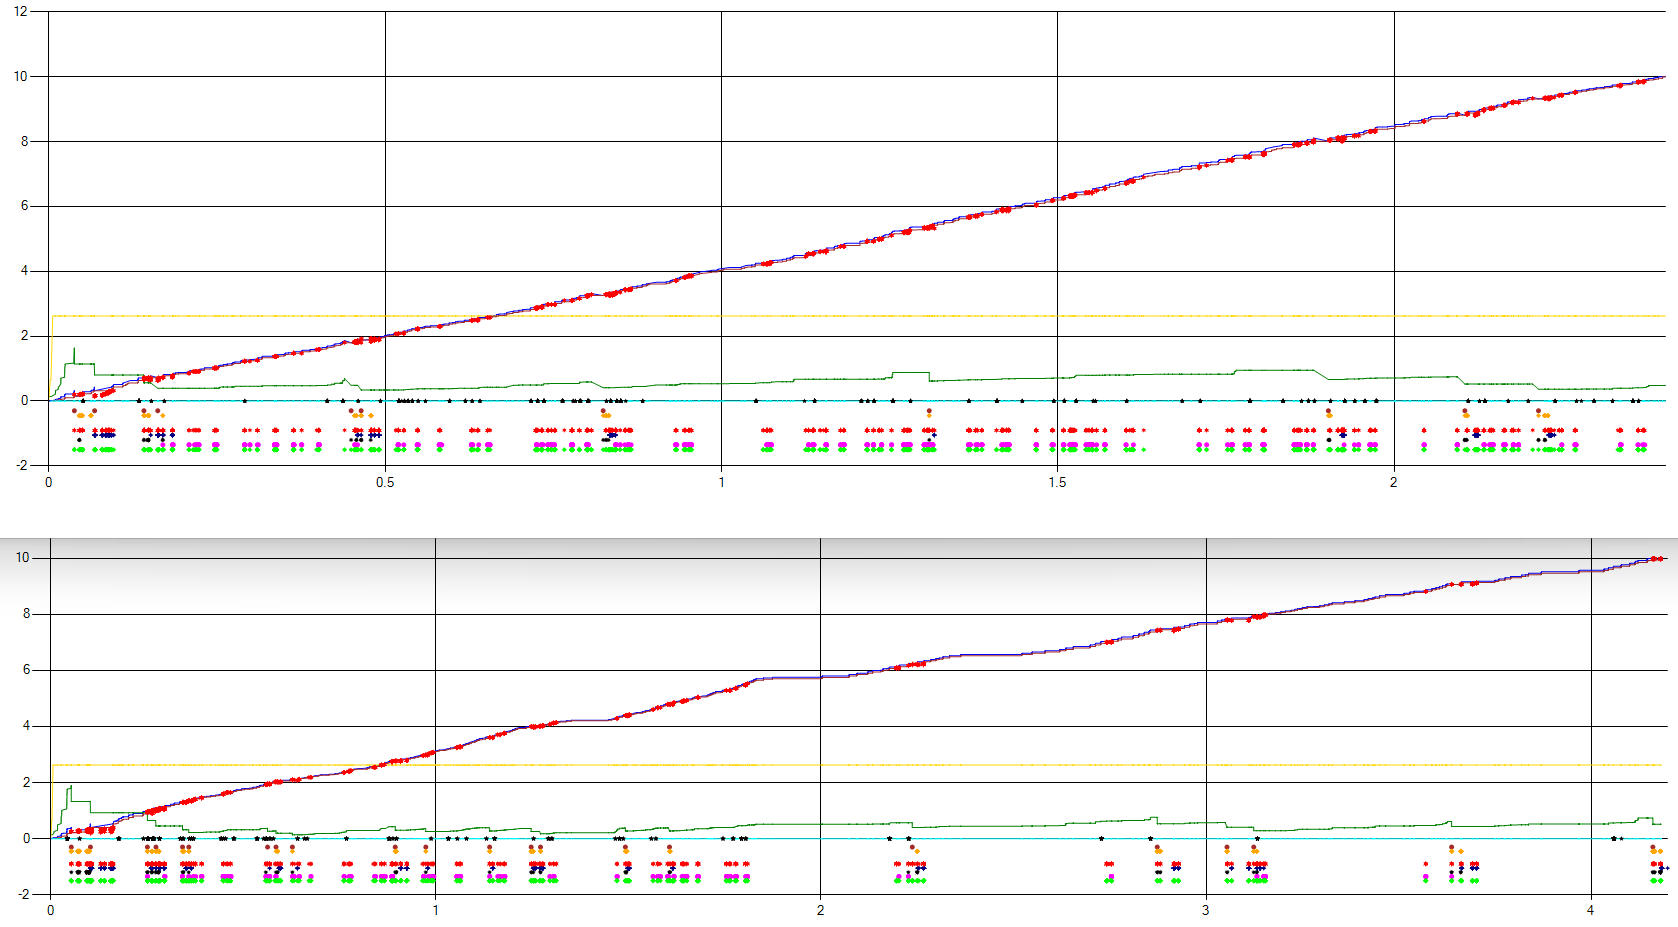
What follows are traces of two 10 MB “discards” (TCP port 9), with and without the patch:


With the patch (above), the 10 MB discard takes about 2.4 seconds and, without the patch (below), it takes about 4.2 seconds.

The green line (the congestion window size) is reduced more without the patch, although there is less “reordering” than in the patched test. The yellow line is the send window size (auto-tuned by the server) and is indeed approximately the minimum window size needed to achieve the theoretical maximum throughput.

The dots on and below the x-axis are points at which “interesting” events occur; from the x-axis downwards:

·         Packet reordering

·         TcpEarlyRetransmit (Forward ACK (FACK), Recent ACK (RACK))

·         TcpLossRecoverySend Fast Retransmit

·         TcpLossRecoverySend SACK Retransmit

·         TcpDataTransferRetransmit

·         TcpTcbExpireTimer

·         D-SACK

·         TcpSendTrackerDetectLoss

·         TcpSendTrackerSackReorderingDetected

·         TcpSendTrackerUpdateReoWnd

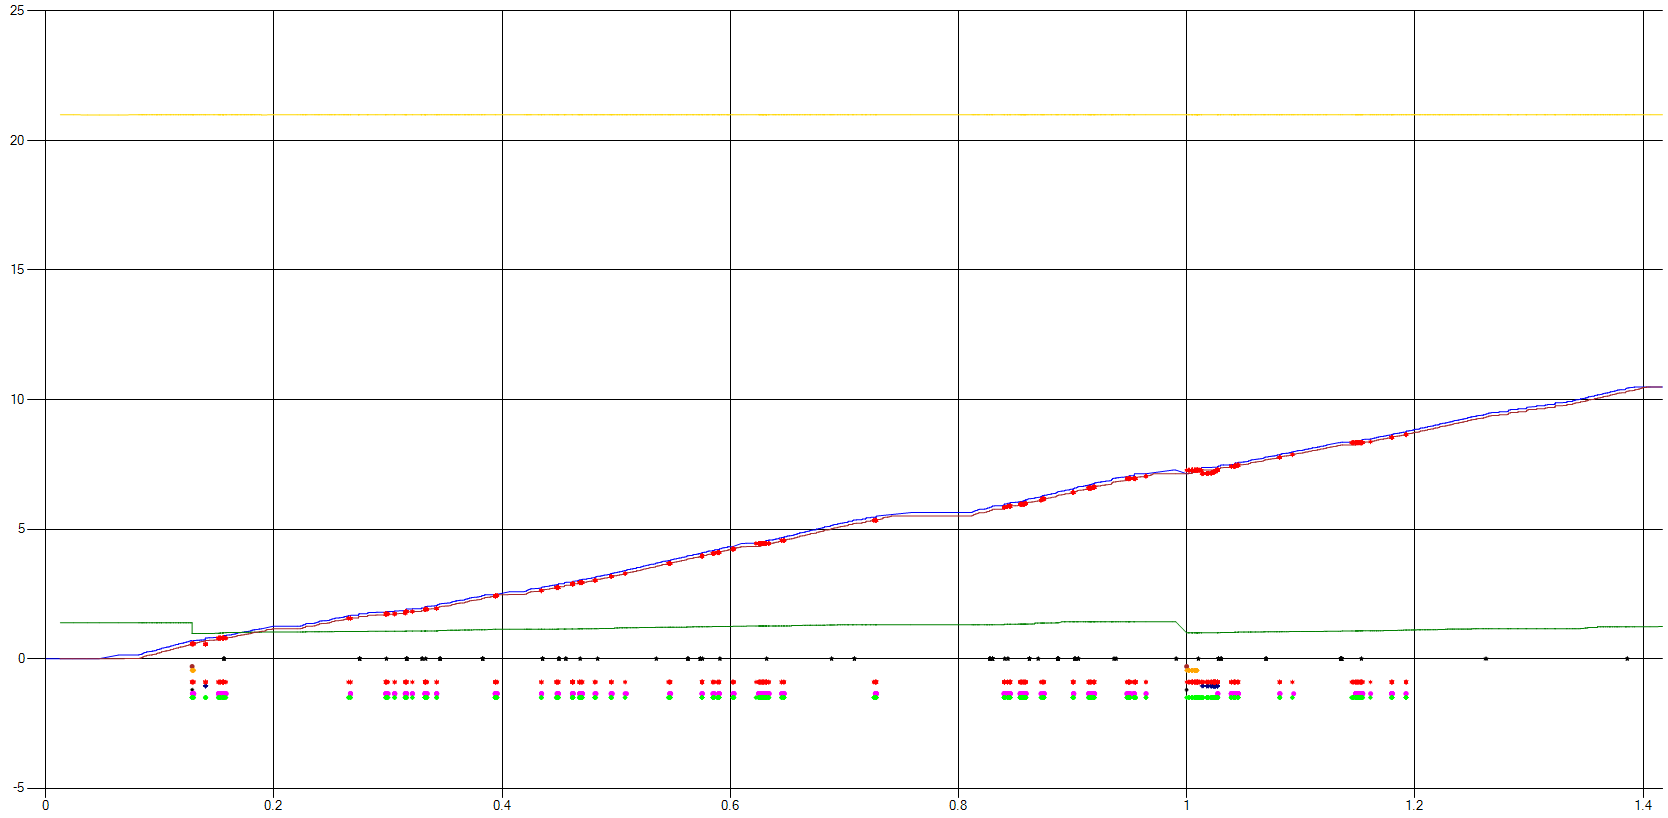
A graph of the Windows 11 trace data gathered by someone with a “real world” setup (minimum RTT of about 9 milliseconds and using SMB file copy to generate the traffic) and no patching looks like this:


In this case, the initial reordering window was large enough to allow almost all reordering to be detected (and therefore to avoid spurious retransmissions).

The trace where D-SACK recognition is working shows that congestion window reduction following a retransmission is not “undone” in the case that a D-SACK shows the retransmission to have been spurious; this may mean that Windows 11 will not perform as well as some other operating systems when sending TCP data over a path where some packet reordering is present.

There are two Microsoft-Windows-TCPIP events that indicated whether D-SACKs are being recognized. In the TcpReceiveSack event, there is a DSackCount member that accurately reflects the number of D-SACKs (as observed in the raw packet data) when D-SACK recognition is working. In the TcpSendTrackerUpdateReoWnd event, there are several members that reflect the state of the RACK algorithm: Multiplier (RACK.reo_wnd_mult), Persist (RACK.reo_wnd_persist), Reownd (RACK.reo_wnd), ReorderingSeen (RACK.reordering_seen), DSackSeenOnLastAck, DSackRound/DSackRoundValid (RACK.dsack_round); when D-SACK recognition is working and D-SACKs are present then this event contains meaningful data.

October 2022 Update: Windows 11 22H2 corrects the D-SACK recognition problem.